

JavaScript programs are mysterious and hidden realms where the magic happens. This can be delightful when everything is working. During development, though, things often won't work so well and understanding why can be hard. It would help if you had a way to dispel the fog and see everything clearly.
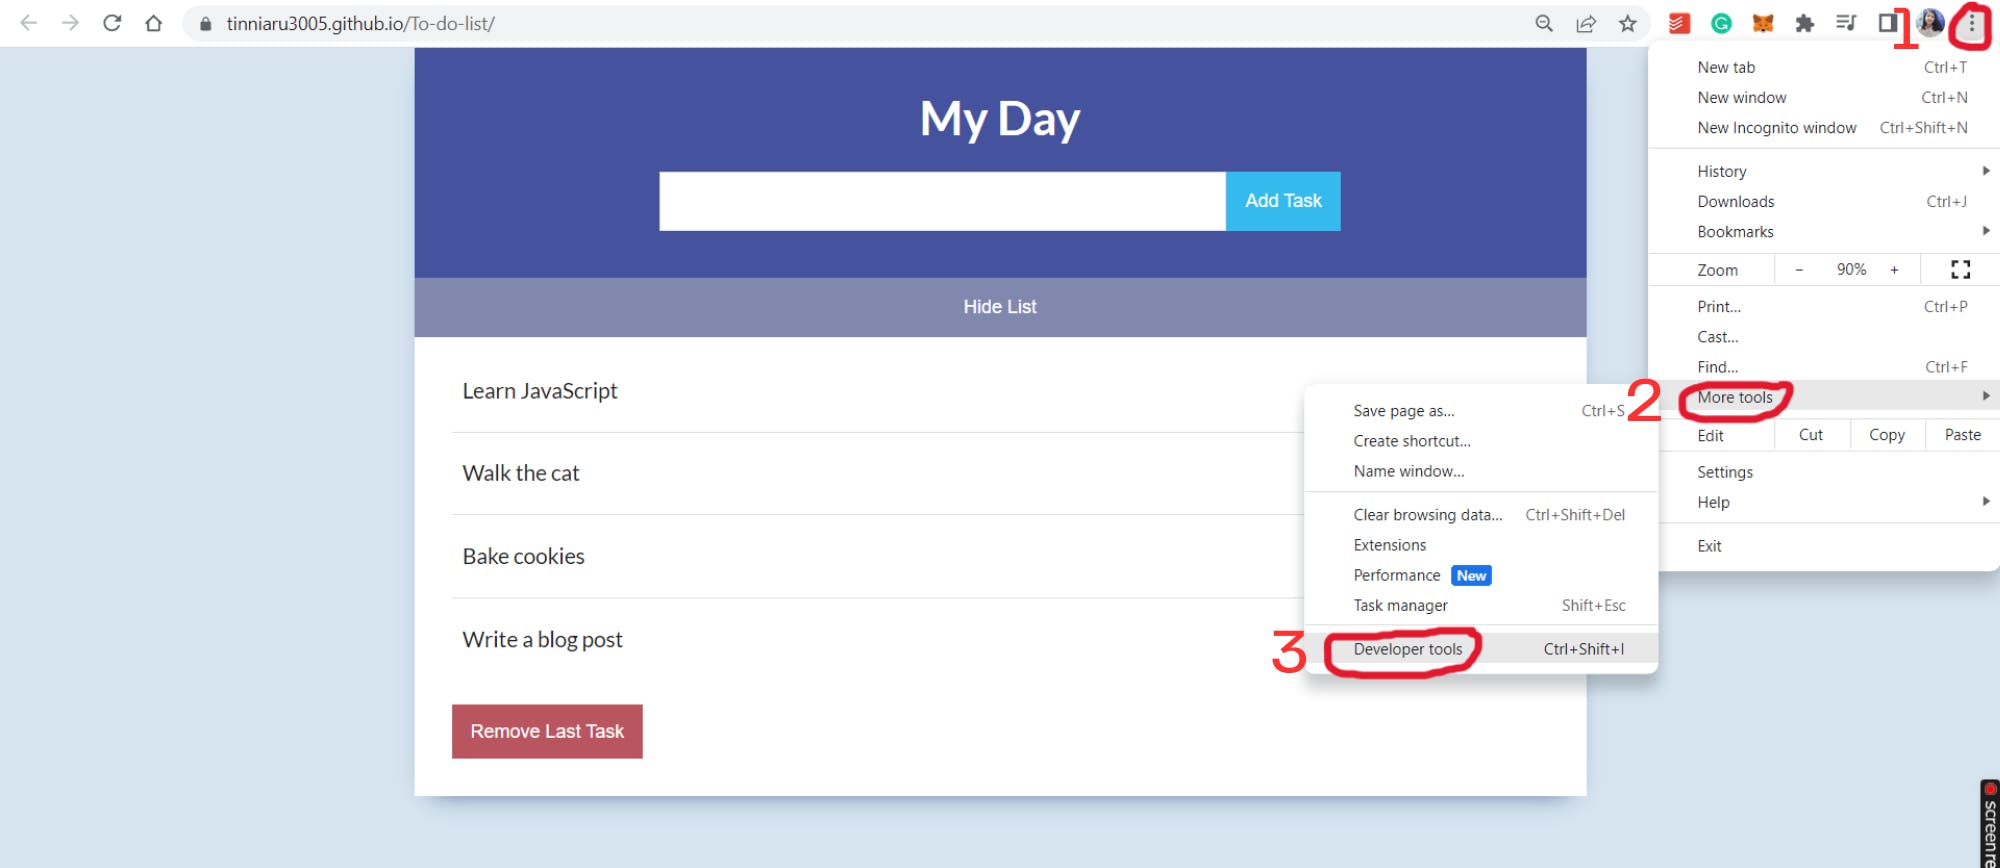
Let's learn how to use a tool that professionals rely on to get crucial insights into their JavaScript programs: Chrome's Developer Tools (DevTools). With DevTools, you can get amazing access to the inner workings of your program while it runs, controlling how it executes with fine-grained control. This means that once you learn the DevTools arts, you can find and fix problems in a snap!
What is Debugging?
Debugging is the process of finding and resolving defects in software.
Taking snapshots of variables using console.log() as the program runs is one of the ways in which developers try to identify what's gone wrong. Logging variables to the console at specific moments in your program can give you insight into where things are going wrong.
But, this process has many issues:
You have to write log statements in your editor, save, switch over to the browser, refresh and if the value in the console isn't helpful then you'll need to go back and edit the code again,
After debugging, you'll have to go back to the program and remove all the log statements.
Sometimes the values you log to the console are live, meaning they can change with the state of your program.
Programs run quickly. Debugging effectively requires stopping your program so that you can look under the hood. Once we stop the program execution at a given line, then you can look around at the different values that exist at that point in time. We can even change their values to see how that affects the program. Then we can step line by line through the code. This way you can see what's happening inside your program as it runs. Finally, you'll identify the problems that need fixing.
Breaking on Events and Basic Stepping
You can also follow along:
Overview of Sources tab in DevTools
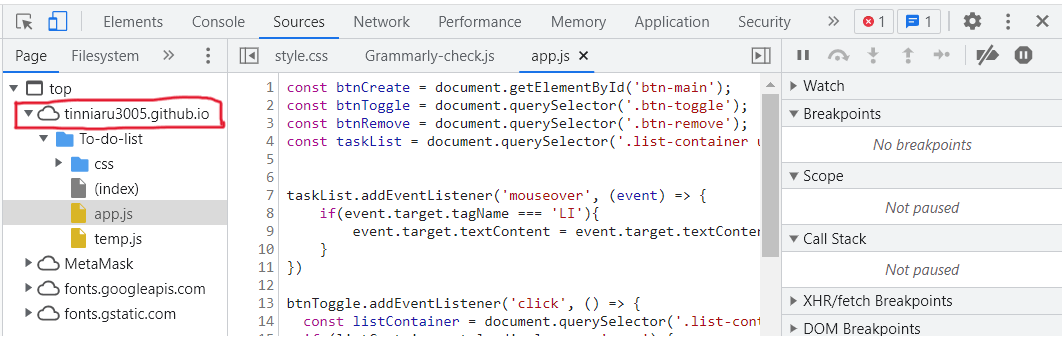
Along the top of the Developer tools window are tabs that control what information you see below. Here we will mainly use the Sources tab.
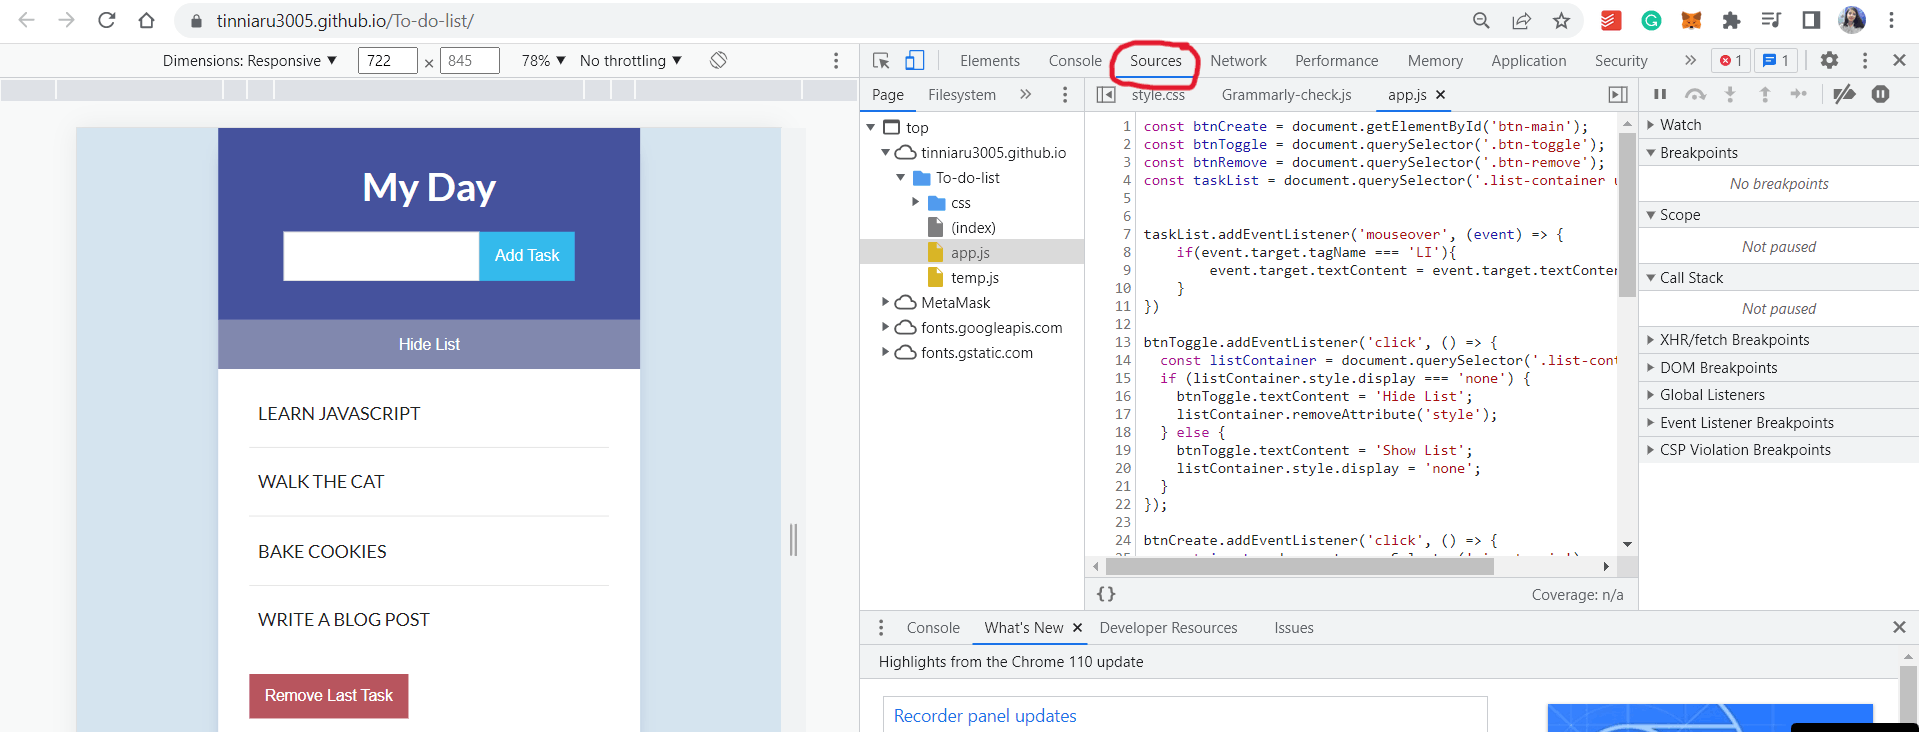
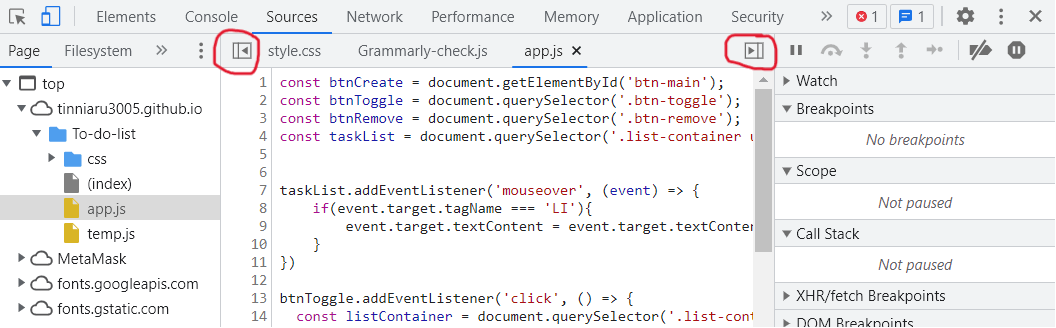
Under this, we can see 3 panes. If they aren't visible then try expanding with these buttons.
In the left pane, you can see a file tree. You can navigate through the assets the browser downloaded here. When we click on them, the contents show up on the middle pane. If you cannot see the content then try refreshing the browser. DevTools sometimes need a refresh after you first open it to reset itself.
There is also a name which shows how you are serving the app:
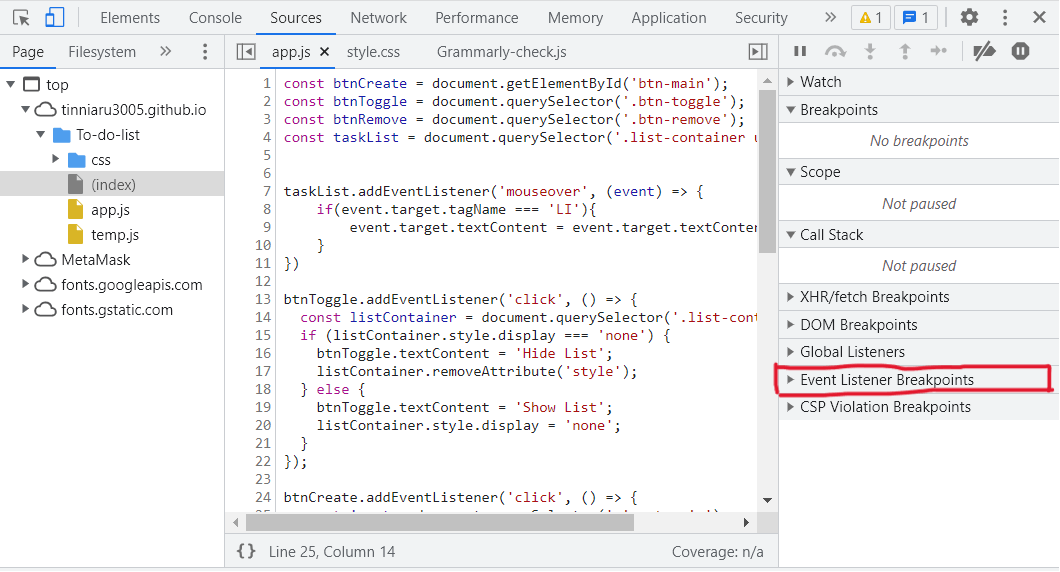
In the right pane, we have a number of tools that we can use to debug our code.
Set an Event Listener Breakpoint
Breakpoint is the spot in our code where we want to pause our program.
In this application, whenever we hover over a task it changes to Upper Case. We want to change a task to Upper Case only when someone clicks on it. Hence, we want to change the trigger event from mouseover to click.
So, let's pause the program execution when the change event occurs.
Expand the list of Event Listener Breakpoints. These are all the types of events we can break on.
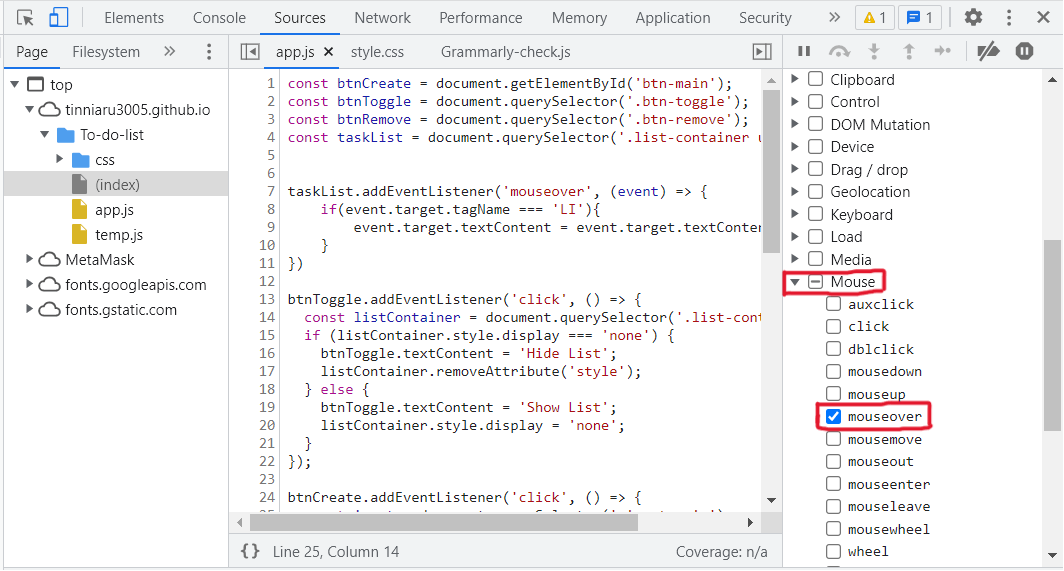
Open the Mouse events and select mouseover:
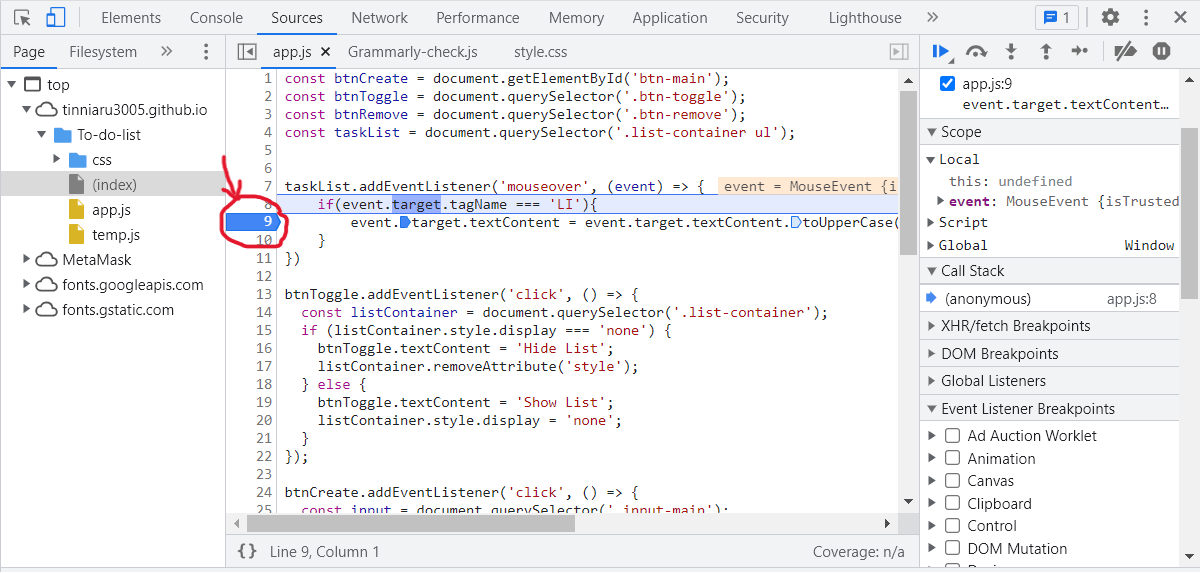
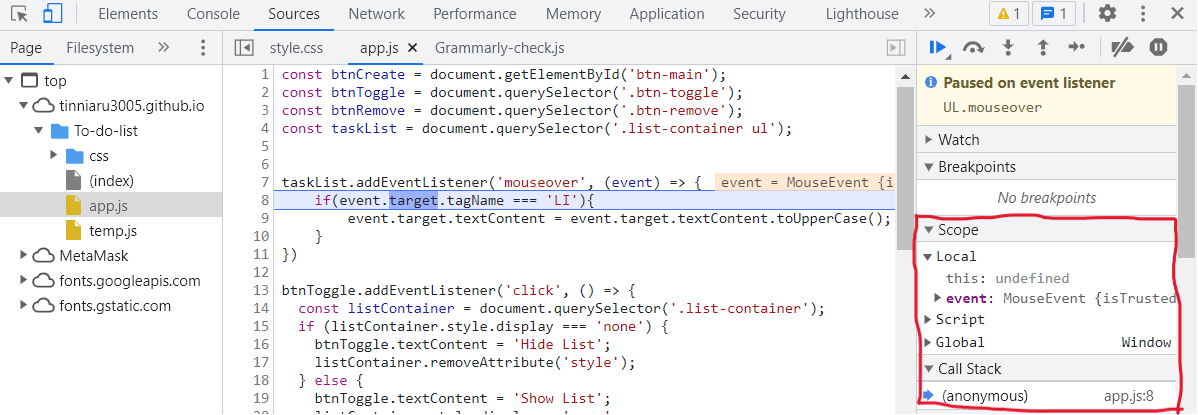
Now when we hover over a task, this is what happens:
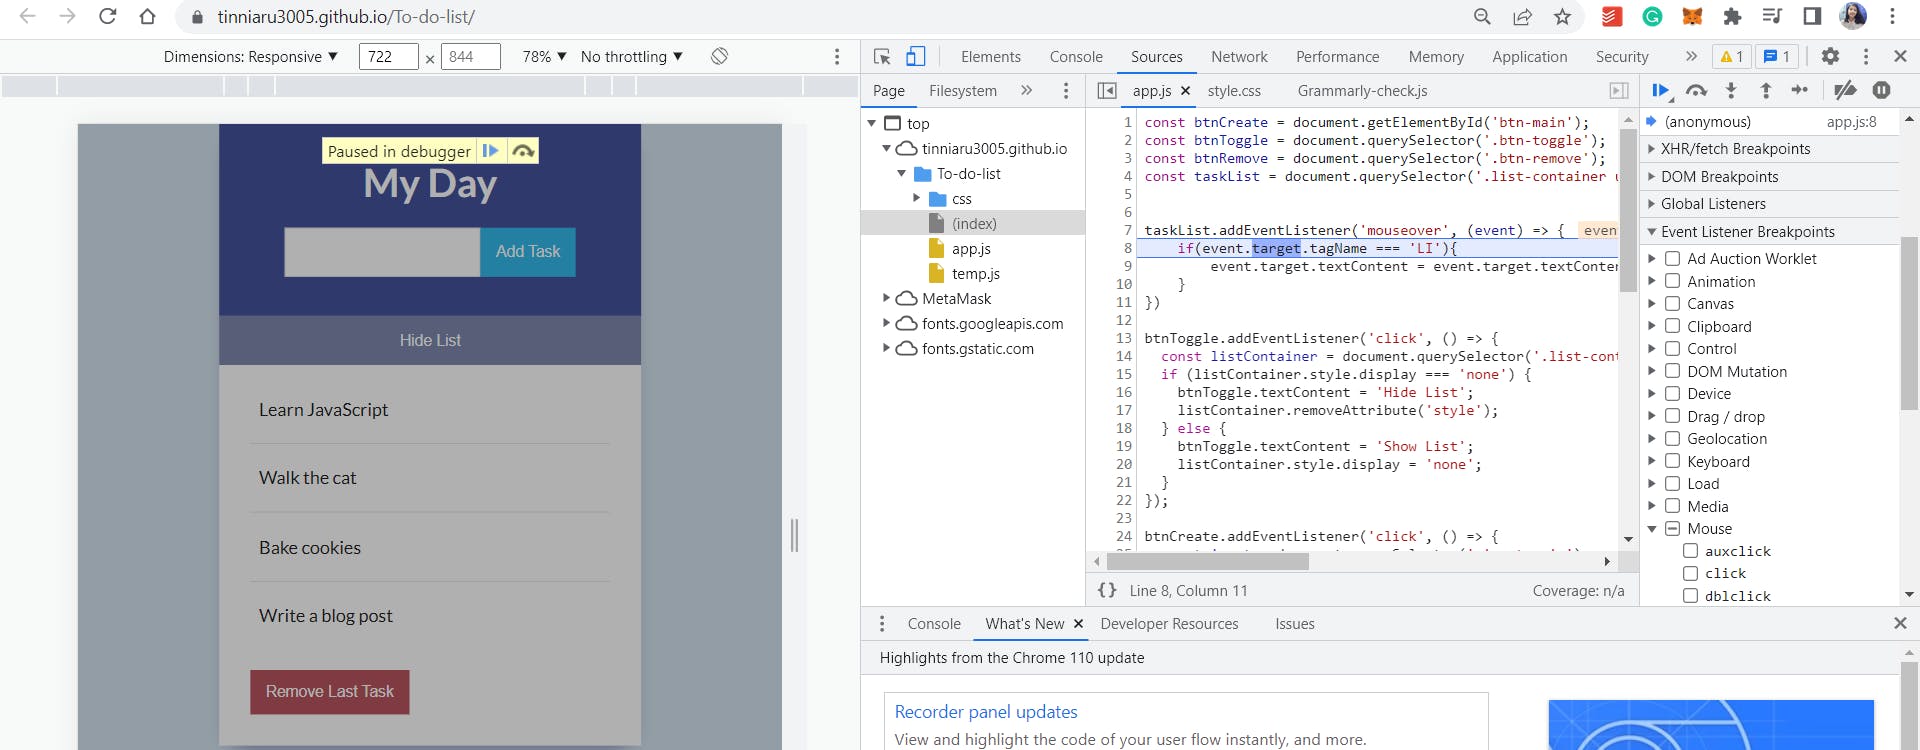
The highlighted line shows where the program paused. That's the spot in the code where the listener function begins.
In the line above the highlighted line, we need to change 'mouseover' to 'click' so that a task changes to Upper Case only when someone clicks on it.
All variables and values in the current scope
In the right pane, under the scope, we get a list of variables that exist in the current function scope.
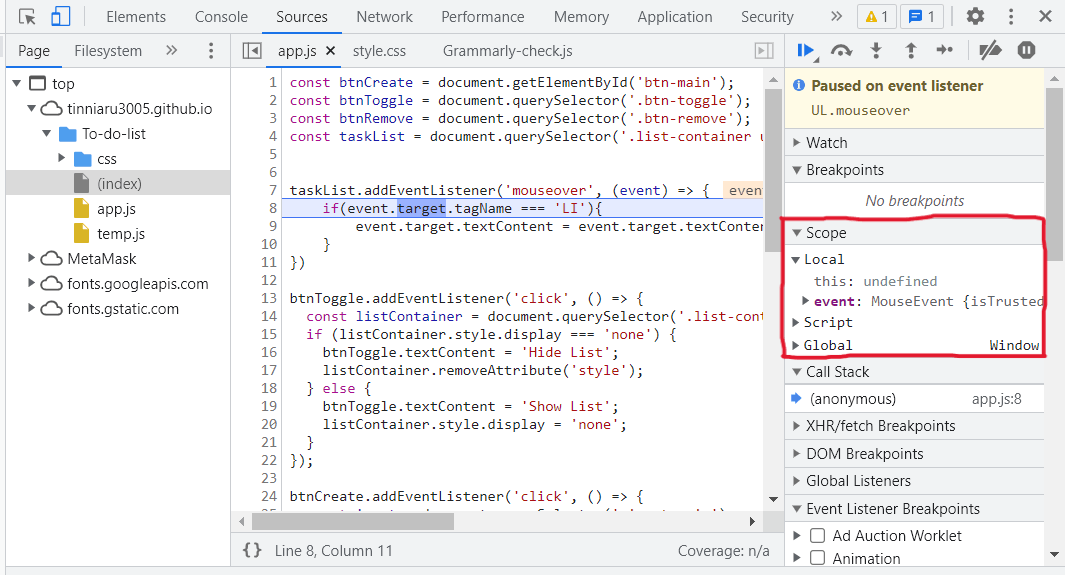
As we paused before any of the lines of the handler have executed, none of the variables listed here has been assigned. So they are undefined. As we move forward through the function and these become assigned values though, you'll see this window will update to reflect the current state.
The event object was passed in when we triggered the event and so it is defined.
You can also see the this keyword. You can read more about it from the MDN page explaining "this".
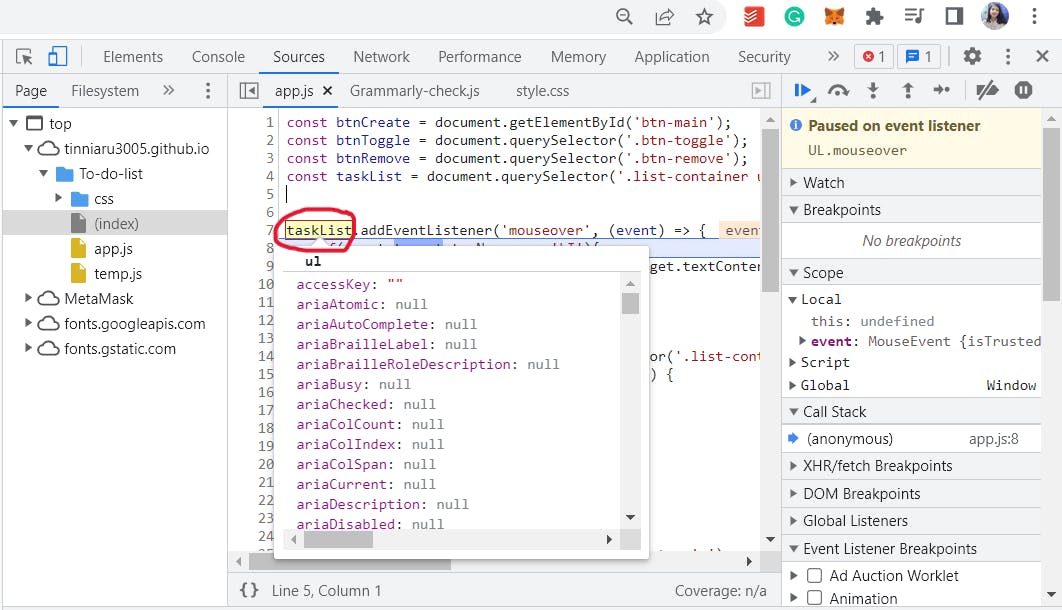
Step over button, seeing code execute line-by-line
We can step through each line of the function using the step-over button. We can click on it to see how the code is getting executed line by line, and the variable changes. Here, the lines are highlighted before they are executed.
We can also hover over the variables to get a window displaying its contents.
To debug, whatever changes we do here, we need to rewrite all of them to our code in the editor.
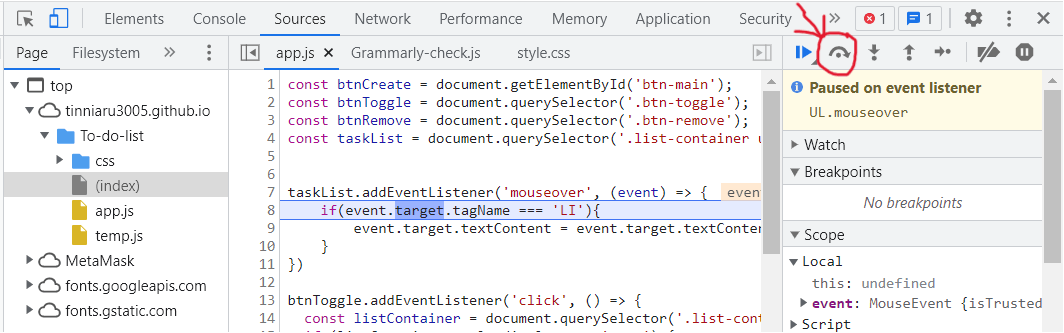
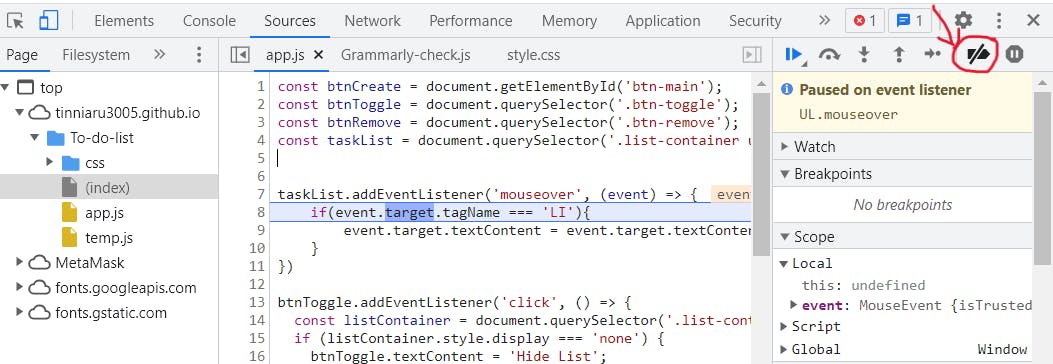
Disable/enable all breakpoints
By clicking on this button we can disable or enable all breakpoints.
Basic and Conditional Line Breakpoints
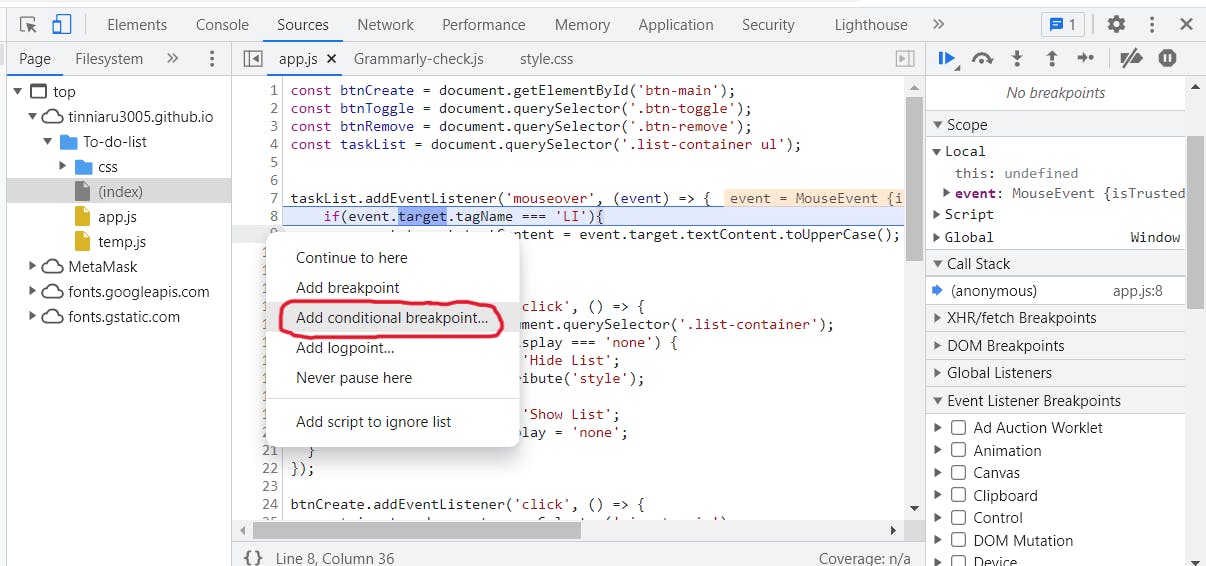
To add a line breakpoint we have to click on the line number.
We then click on the play button.
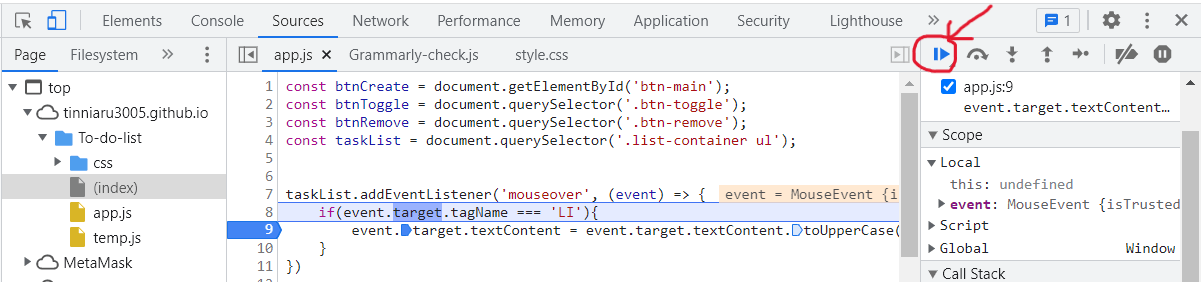
The play button pauses the interpreter letting it run until it reaches a breakpoint or the end of the program.
In the case of a loop, if we click on the play button again then it cycles around the loop once and lands on the breakpoint. In this way by clicking on the play button again and again
You can also right-click on the line number to add a conditional breakpoint.
Debugging Functions
If we click on the step over button then it doesn't go into functions but steps over them. Hence we need the buttons next to it:
step into: Step into the next function callstep out: Step out of the current function call. It completes the current function and jumps back to the function that called it
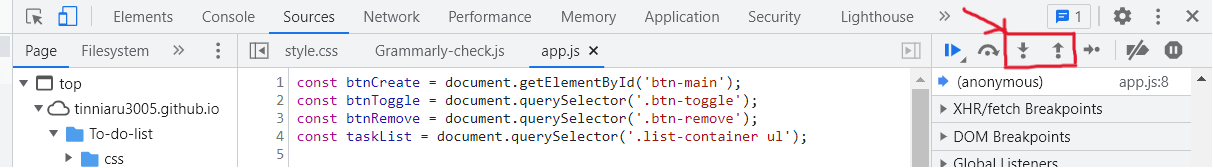
The call stack is a visual representation of what functions are currently in the process of running. The call stack and scope windows help us keep track of where we are. When a function is called it appears in the call stack and when the function is completed it disappears from the call stack.
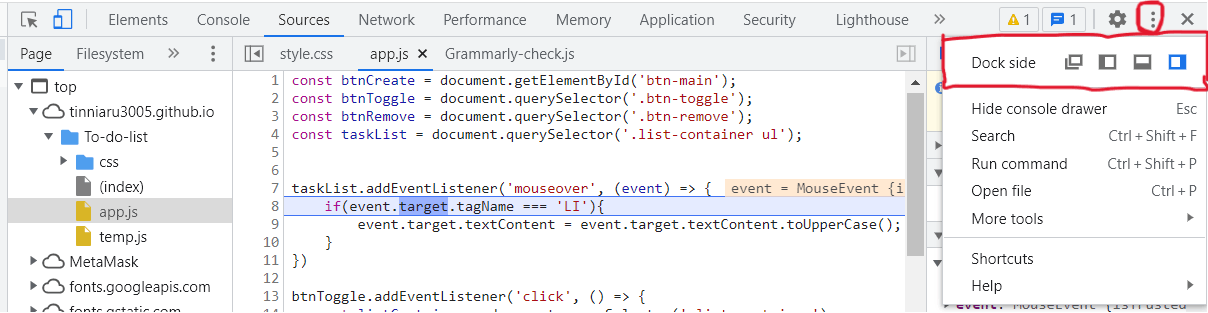
Different Ways of Viewing the Inspect Window
Unlock into a separate window
Dock to left
Dock to bottom
Dock to right
Conclusion
Chrome DevTools Docs is a great place to know more about the various features that it offers. The DevTools UI can be a little overwhelming. There are so multiple tabs. But, if you take some time to get familiar with each tab to understand what's possible, you may discover that DevTools can seriously boost your productivity.