


Table of contents
Introduction
CSS doesn't provide error messages. This is what makes CSS bugs tricky, time-consuming and frustrating. You get to know about it only when the page doesn't look the way you expected it to. 😥
Proper tools can help us perform such debugging tasks easily and accurately in CSS. That's why we use the Chrome Developer tools or DevTools. They are debugging tools built into the Google Chrome browser. Here you can debug CSS by inspecting elements. It helps in understanding how CSS is applied to your website. 😎
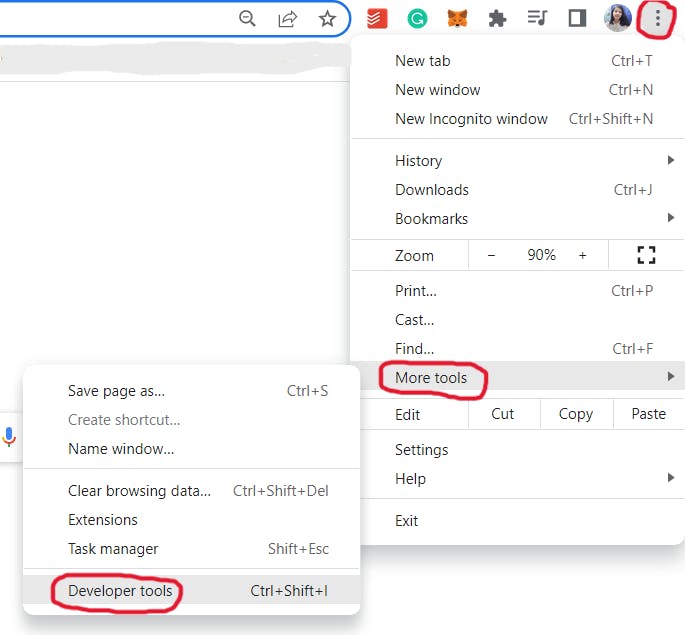
There are several ways to access DevTools:
➡️
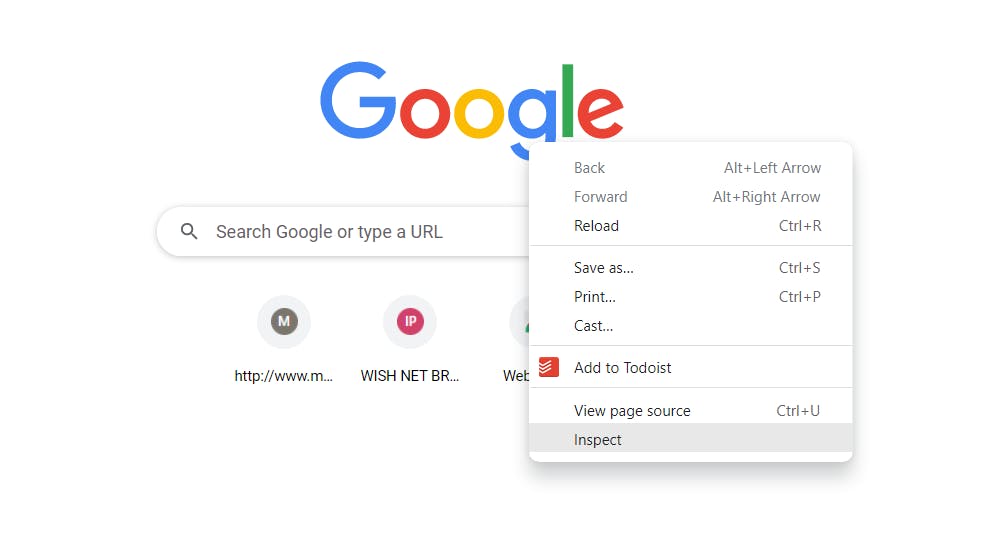
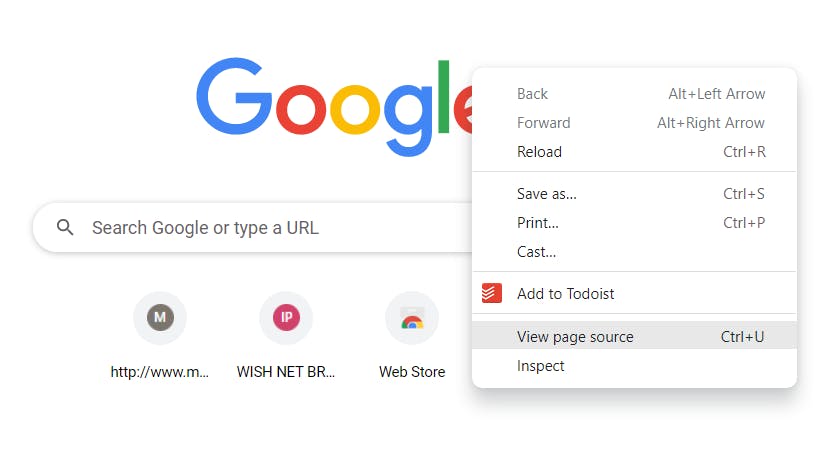
➡️ We can also right-click on any page element and select inspect:
➡️ The quickest way is to use the Keyboard shortcut:
ctrl+shift+I on Windows
command+option+I on Mac
❌ Simply reading the CSS is not an efficient way to figure out what is going wrong.
✅ Instead, you can open Chrome DevTools, select the problem element and inspect the styles applied to it. The Styles pane provides a lot of features to isolate and fix the problem quickly.
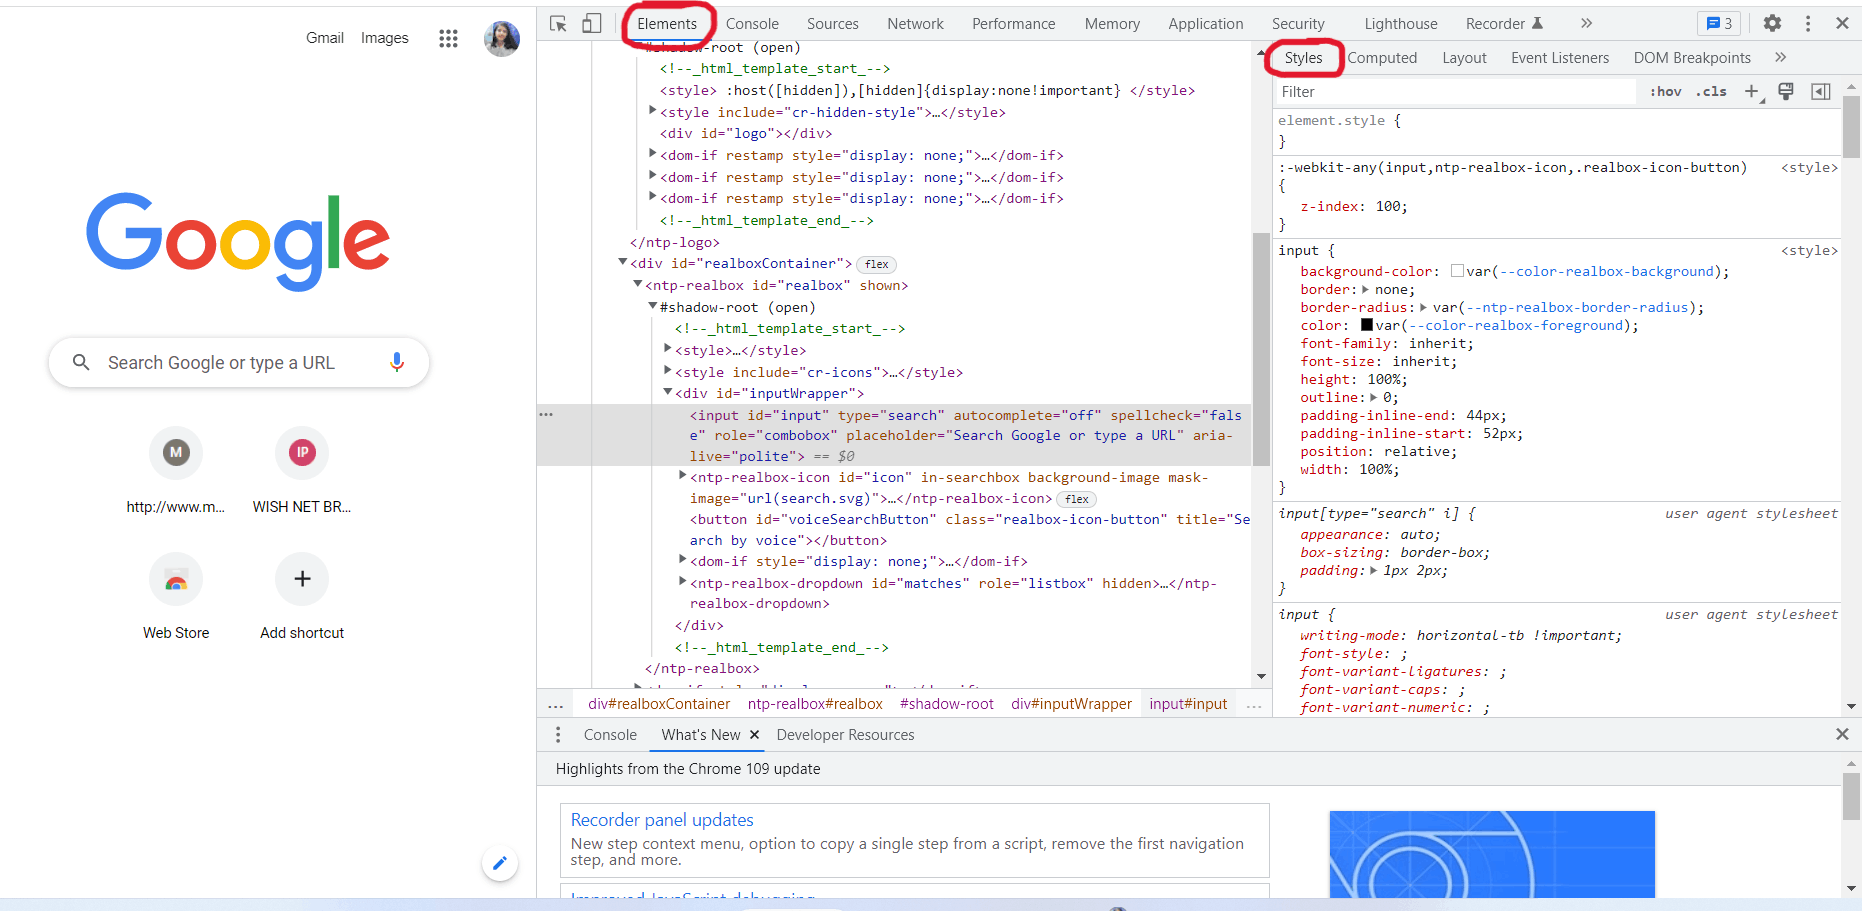
The Elements Panel
The Elements panel displays the Document Object Model (DOM) structure of the webpage. You can read more about it from the MDN Docs. In simple terms, it contains the HTML code that makes up the page. It provides a real-time representation of your HTML including any changes being made to the DOM.
If we right-click on any element and click view page source then we don't get real-time representation.
Select Element
Click on the select icon (marked by a red circle) on the top left corner of the panel.
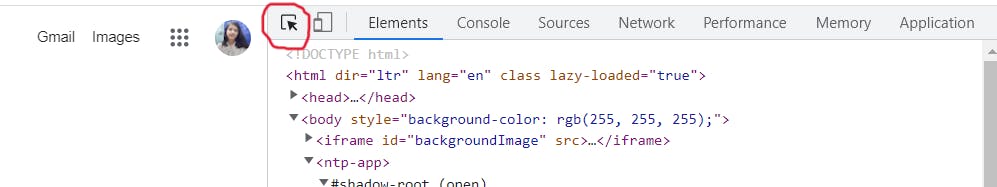
Hover over any element of the page to inspect it.
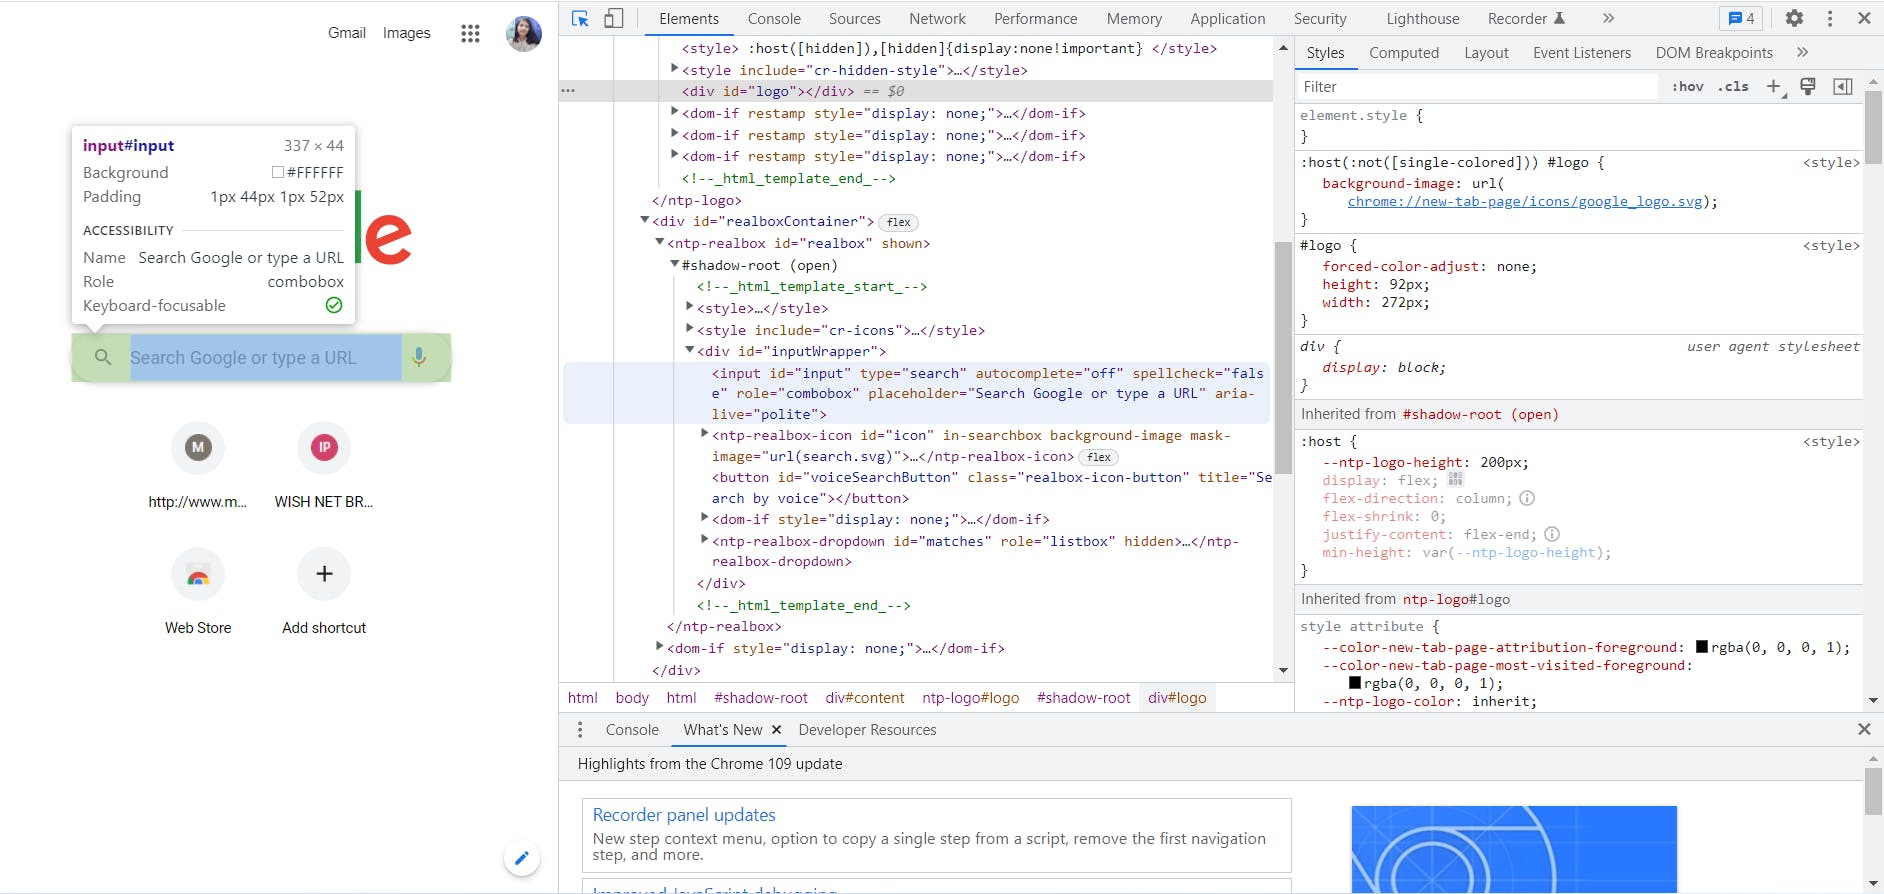
Let's have some fun. 😉
Let's change the placeholder value of the input tag. To do so we have to double-click on it from the Elements panel.
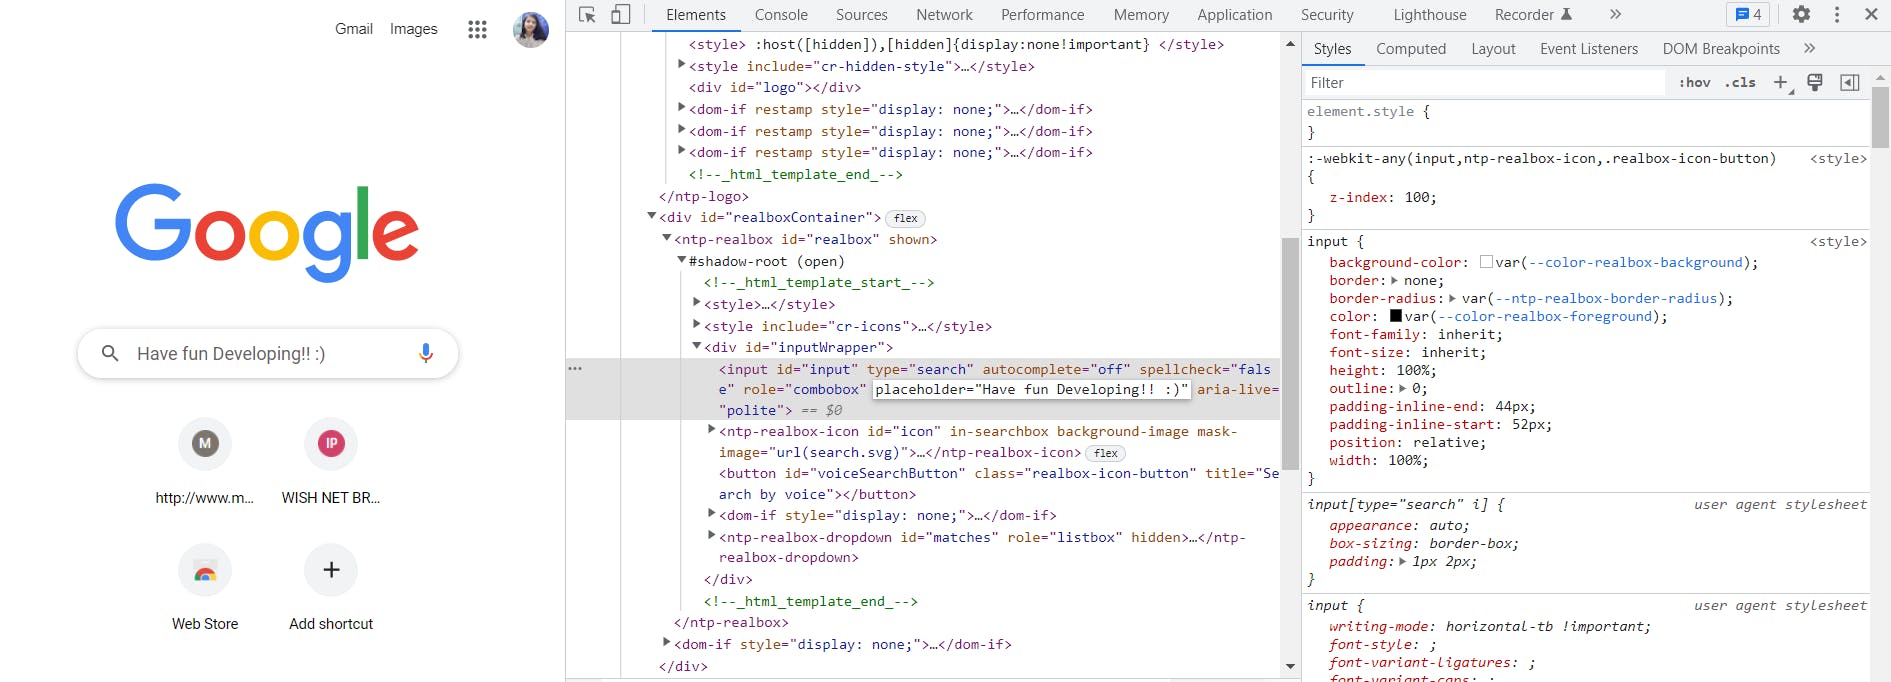
We can also right-click on the input element from the Elements panel and select Edit as HTML from the drop-down menu. This makes the entire input element editable. Now we can change the placeholder value. Then click on a blank space outside to apply the changes on the page.
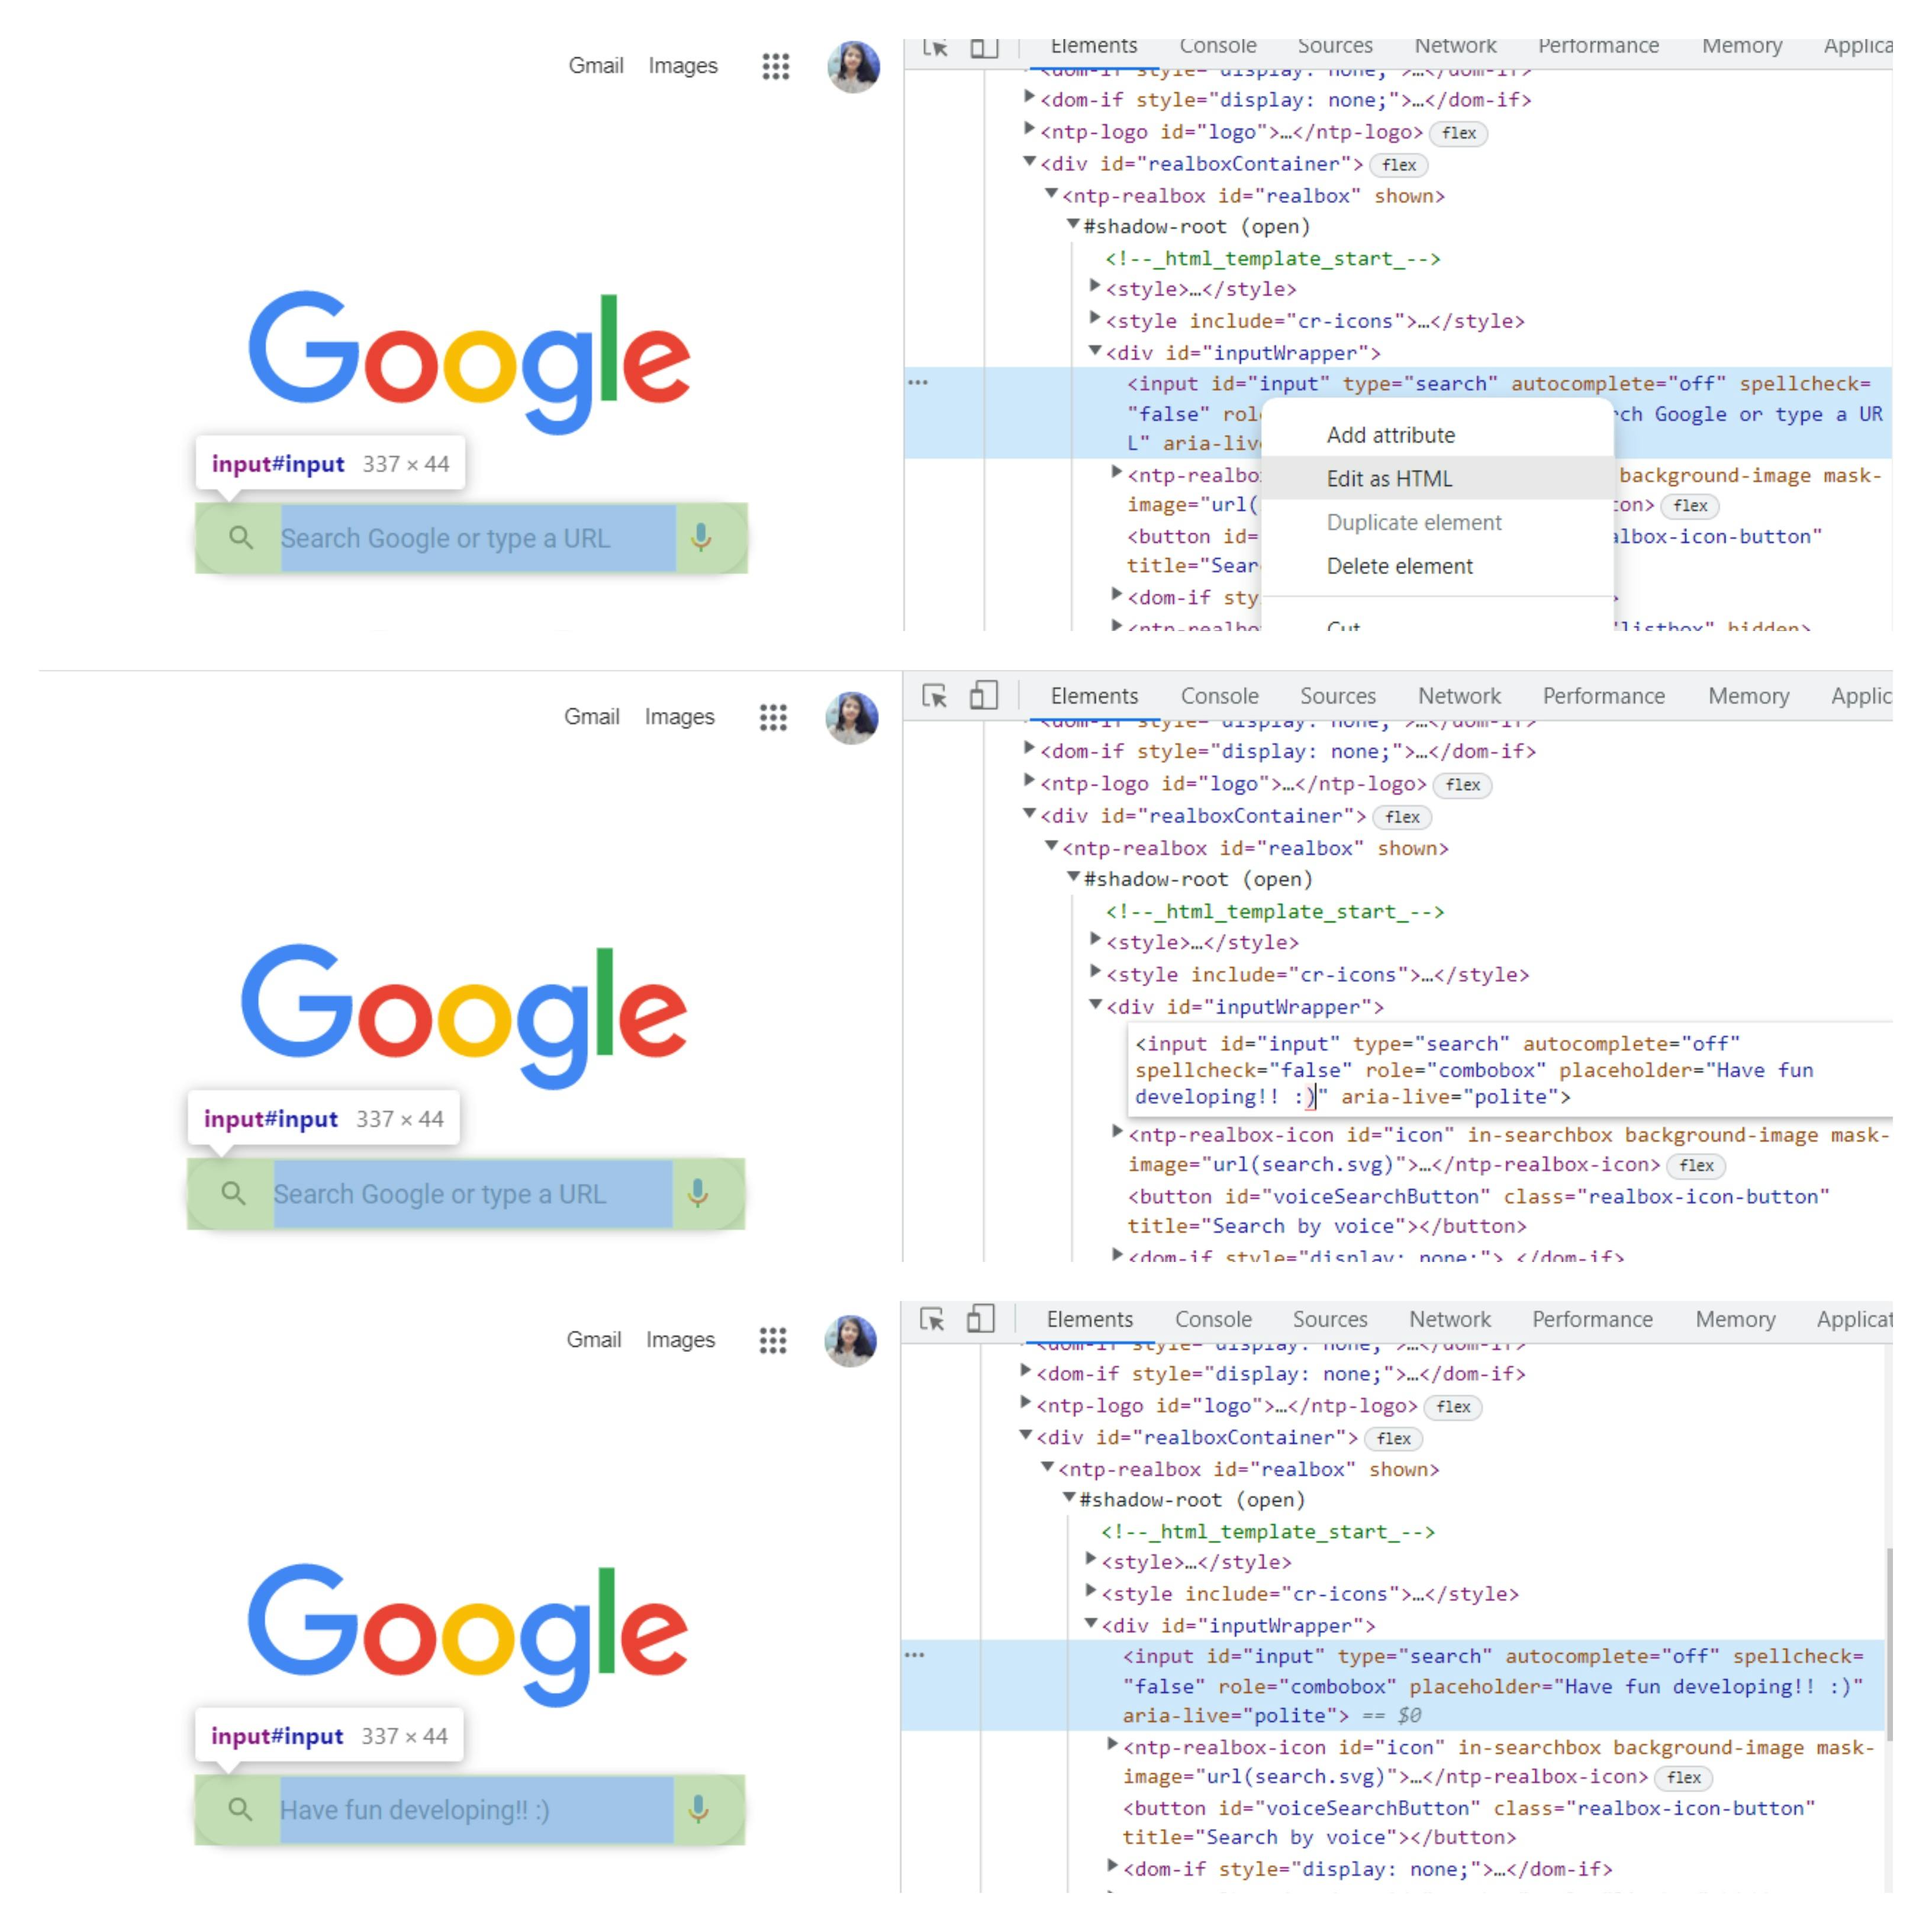
Here, by changing the placeholder value you can change in contents of the page in real-time. But this change is temporary and we get the original page back when we reload.
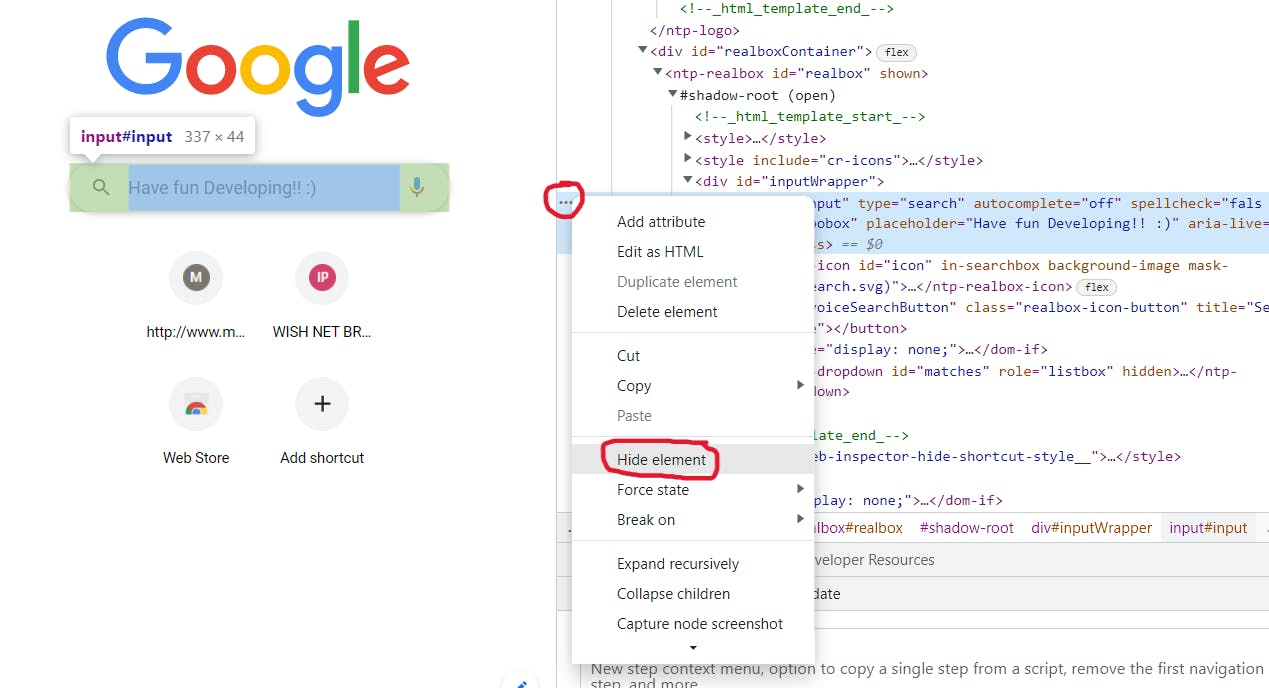
Hide element
By clicking on ... on the left and selecting Hide element, you can also hide a particular element.
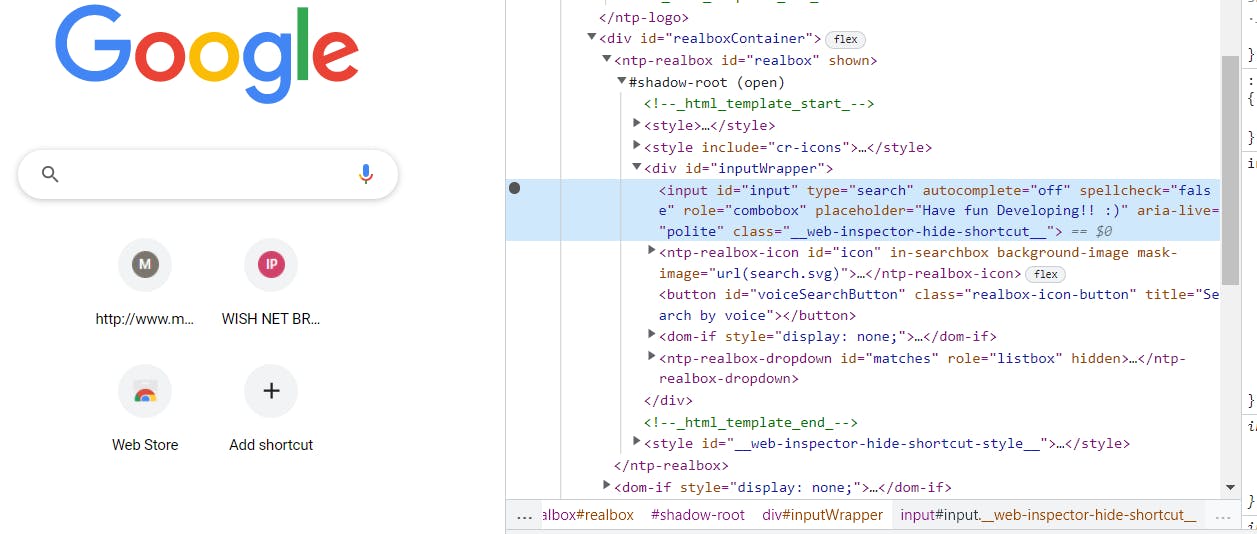
Now we can no longer see the input element.
Similarly, we can explore other options also like Delete element by clicking on ...
Editing a group of HTML
Visit this link (To-do-list) to follow along.
Let's navigate the codebase together! 👩🏻💻✌🏻
Right-click on any of the list elements and select inspect from the drop-down element. Click on ... and then select Edit as HTML.
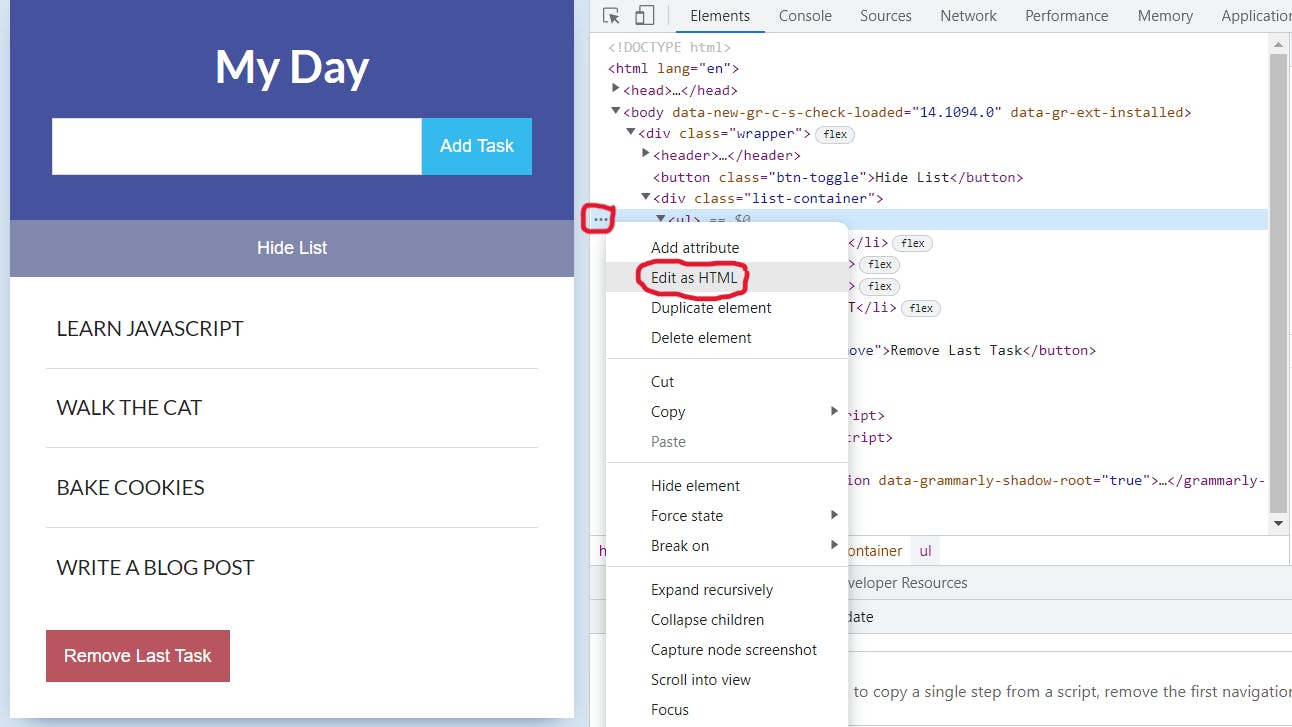
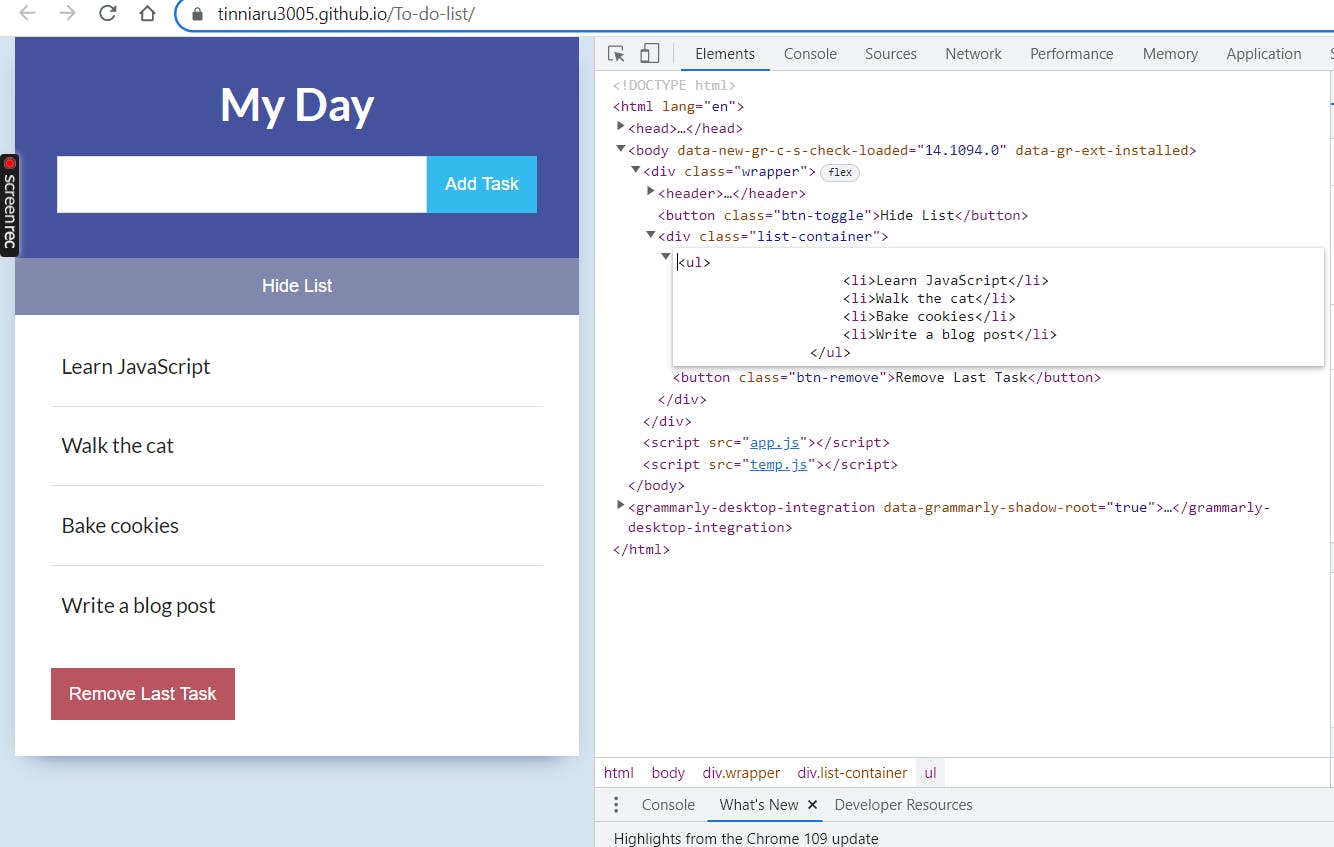
This makes the selected code editable. After making the changes, click outside the Edit box and changes can be immediately seen on the browser.
Finding an Element
We can also use the Elements panel to identify a particular type of element or an element with a particular class or id. Hence we can quickly find an element in our HTML and quickly inspect it. Click ctrl+F to get a search box (as marked in the image).
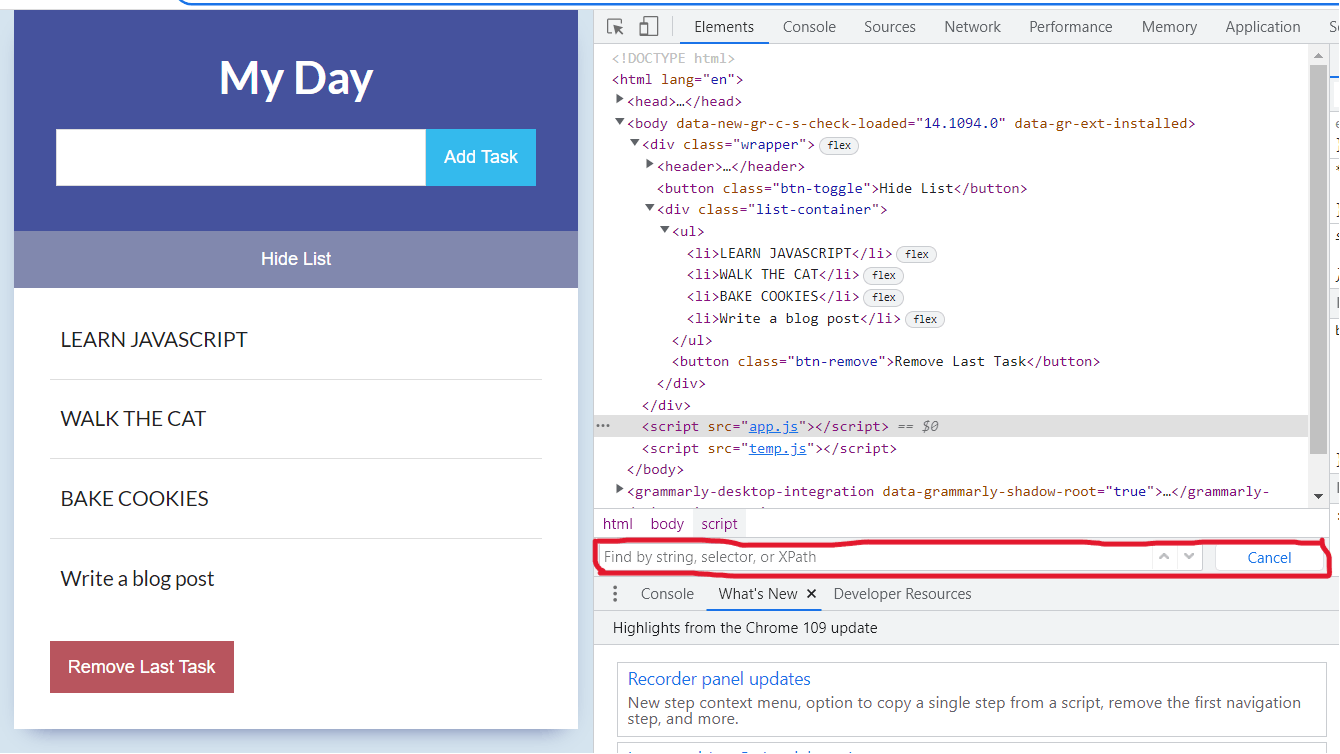
We can use this search box to search elements by type, class or id. When we search that particular item is highlighted. We can click the up and down arrow keys to individually inspect all elements with the searched type, class or id.
Styles
Select an element from the Elements panel to view its CSS in the Styles panel. Here we can edit, add or remove CSS properties and see the changes immediately applied to the page.
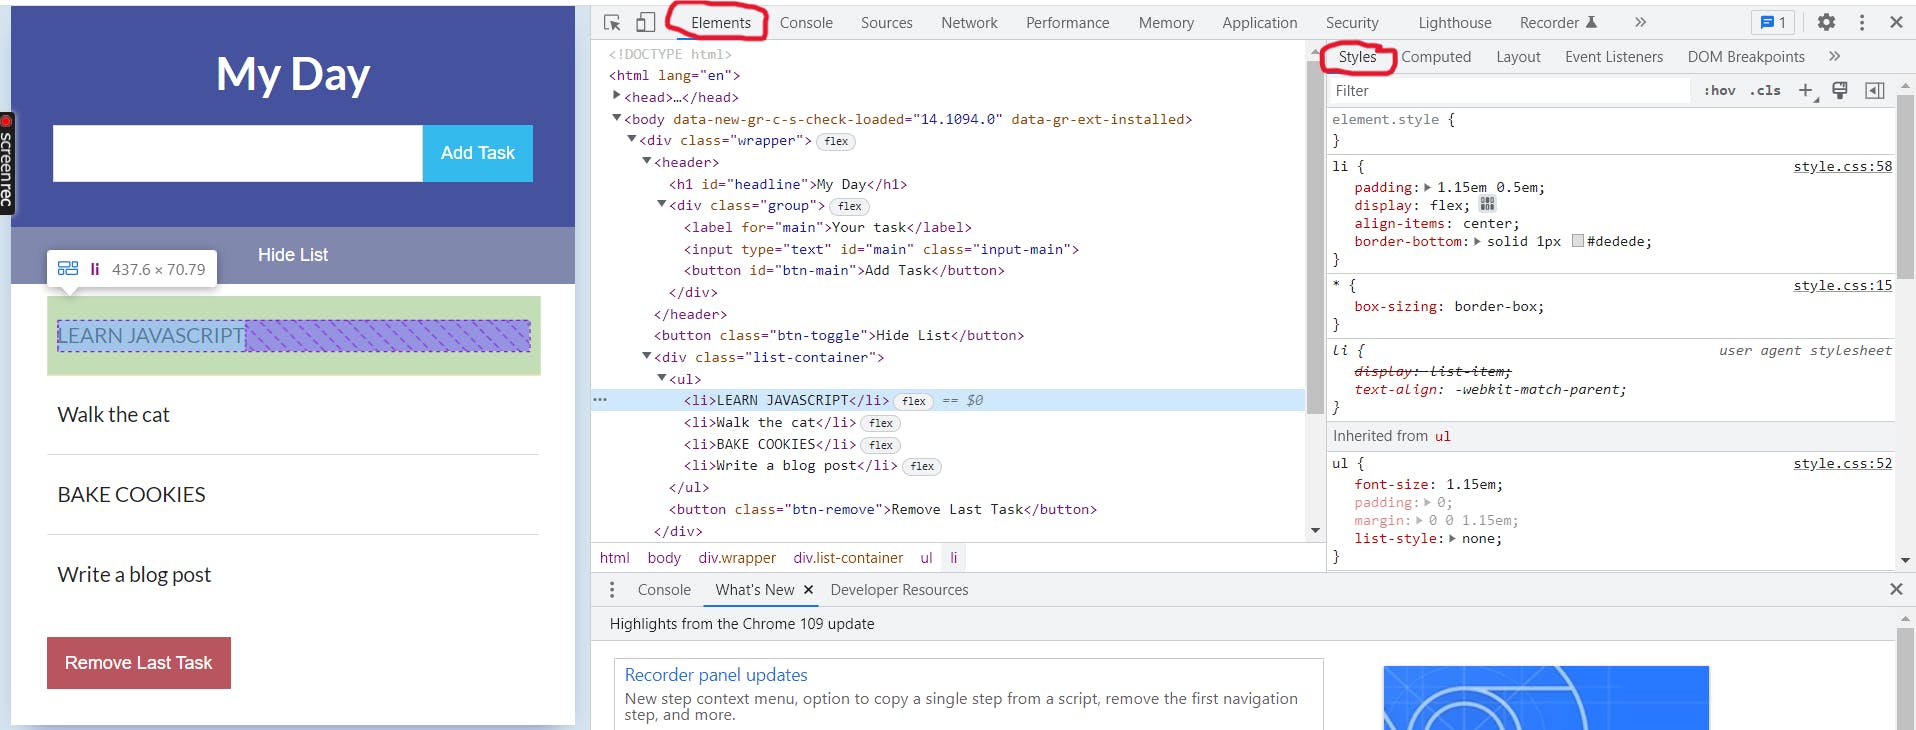
The CSS rules are listed from highest priority to the lowest
element.style is the CSS applied directly to the element using the style attribute. They have the highest priority or specificity in CSS. Hence this at the top of the Styles panel shows any inline CSS applied to the element. An inline CSS can be written directly in an HTML tag or added by JavaScript.
*{ } is a universal selector and it matches with every element on the page.
- Hover over the CSS property to see the effect on all the elements. Example: If you hover on the
padding, you can see how it is applied to the element.
Click on the CSS property to be able to modify it. If the property value is numerical, we can use the up and down arrow keys to increase and decrease the value of a CSS property.
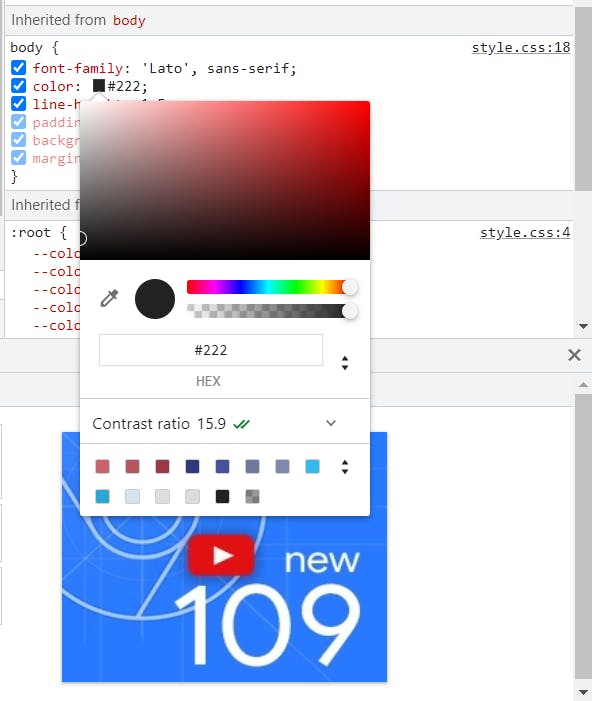
We can click on the
colorbox (◼️) to test various colours using the handy colour picker.
Click on the blank space beside the CSS properties to add another CSS property
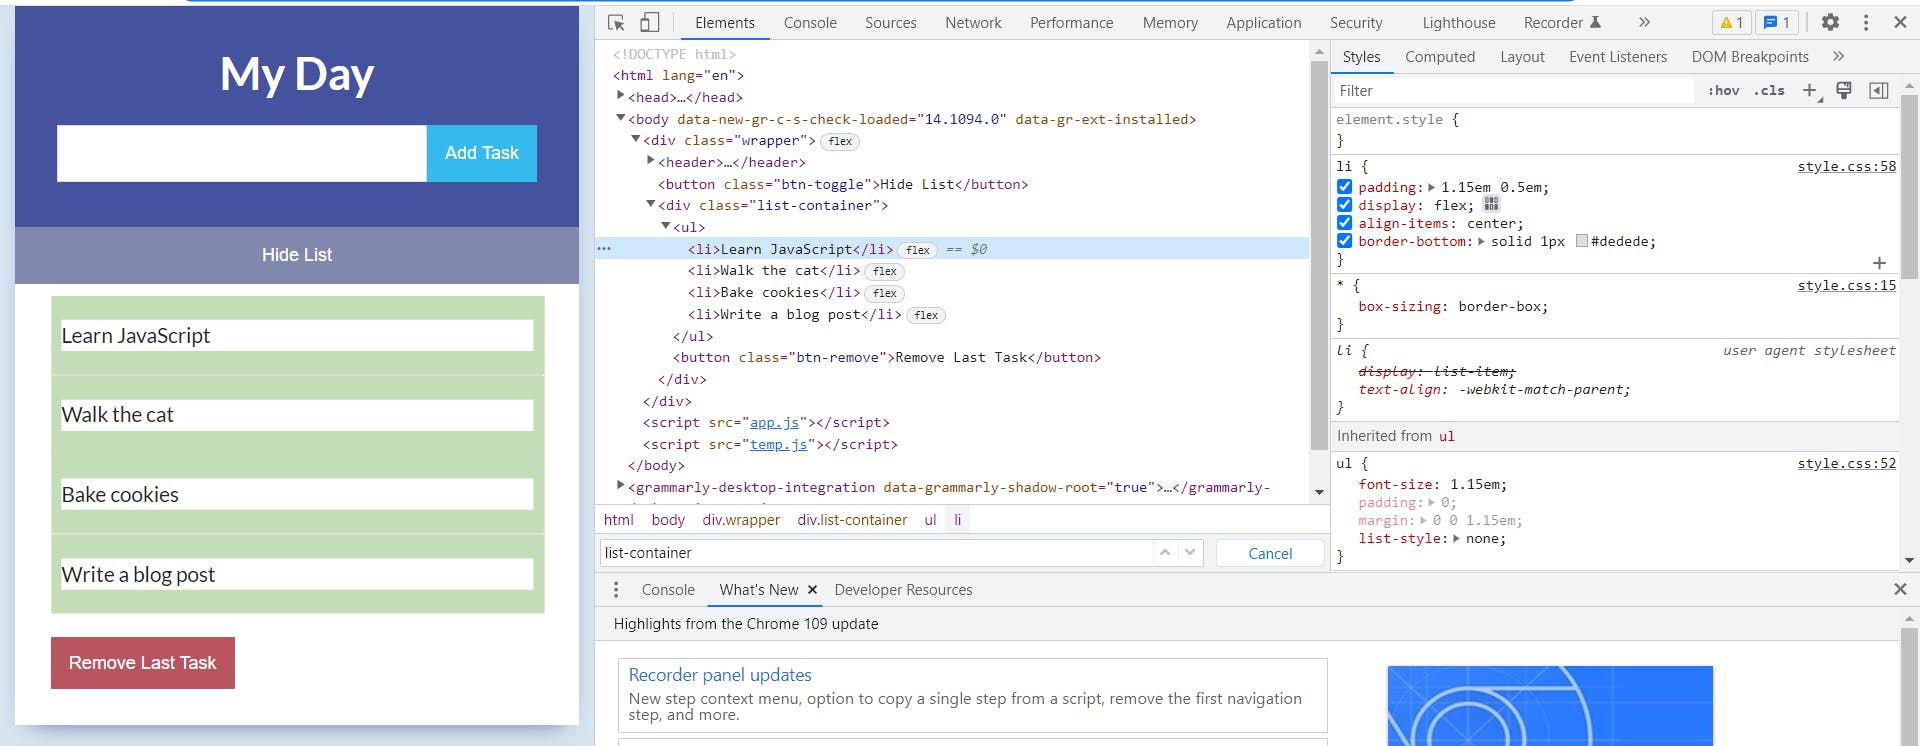
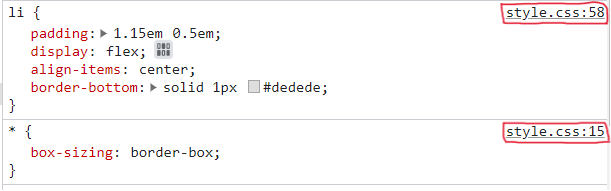
When you hover on a CSS property a checkbox (☑️) appears to the left of the property. Click on the box to uncheck the checkbox and disable the CSS property. Example: Let's remove the
paddingfromliitems to see how it looks.
background-color: var(--color-add);means this property is overridden.
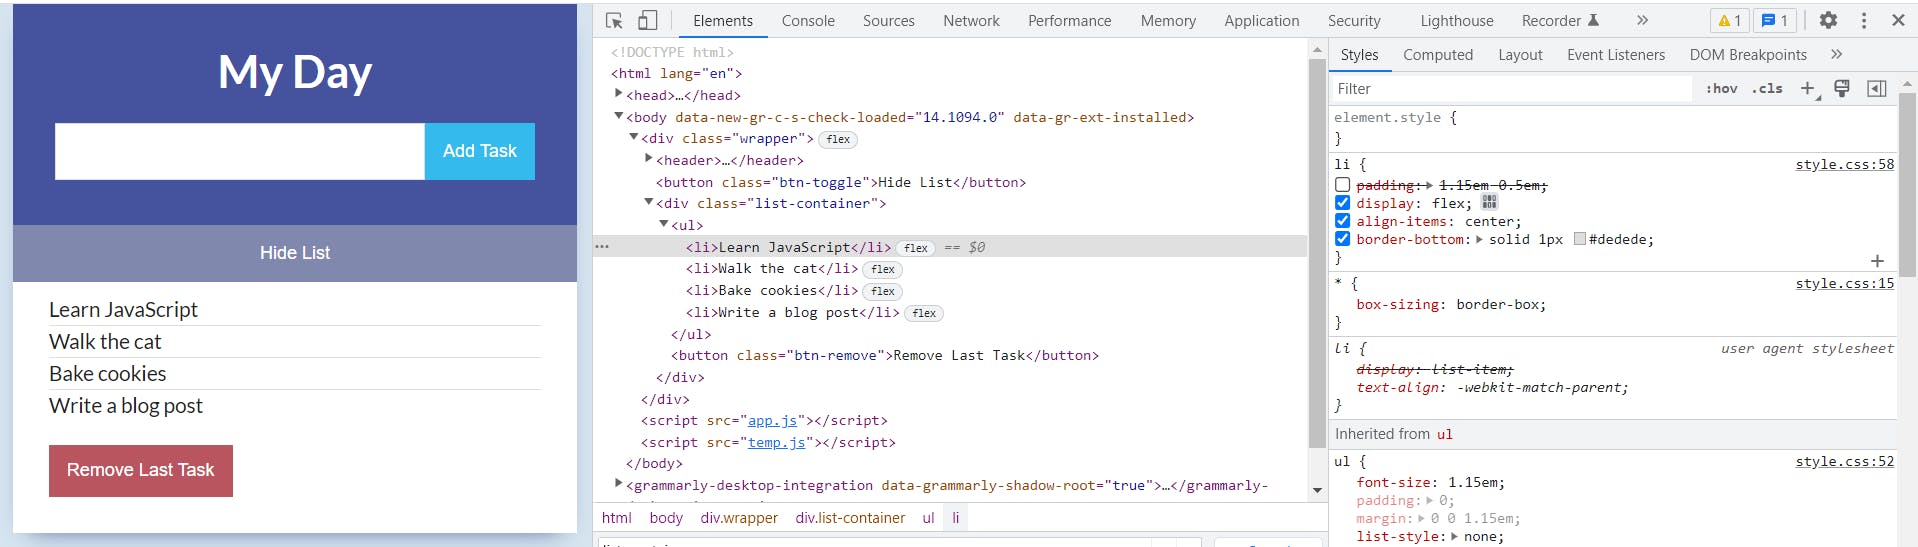
Viewing Inherited and User Agent Styles
CSS styles can cascade down or be applied to elements from many different places. The Styles pane also displays which properties are being inherited by or passed down to the selected element.
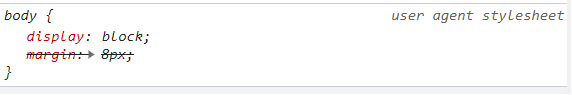
We didn't write this. These are applied by the user agent stylesheet. This is the stylesheet supplied by the browser itself. These can be overridden by the CSS you write.
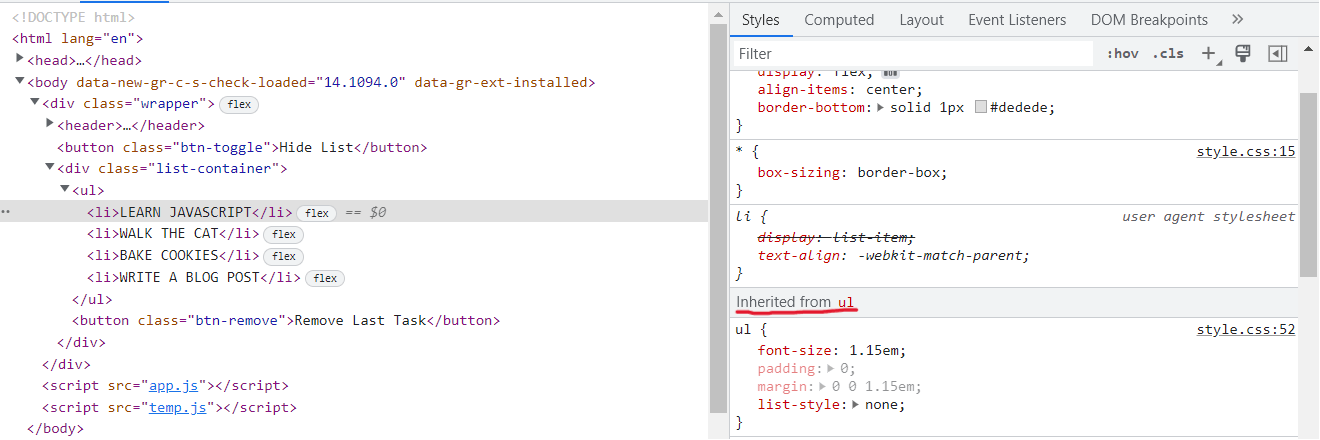
Inherited from ul means the li element inherited these properties from the ul element. padding and margin are dimmed or greyed out. It means they are non-inheritable. It means their values are not passed down from ul to li element.
Identify and Debug Errors
CSS doesn't provide feedback or error messages if your code contains invalid declarations or syntax errors.
Click on the blank space in the Styles panel to add a new style to an element. When we add a CSS property we also get suggestions:
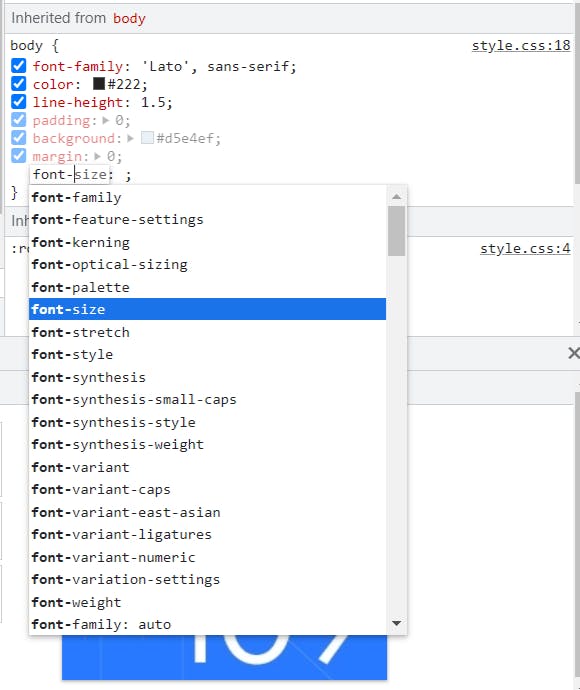
In case we add a wrong CSS property (either name or value), we get an alert (⚠️). If we hover over the symbol, we can see the reason.
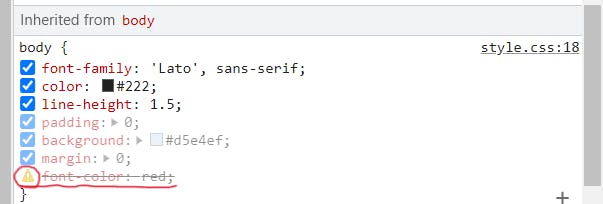
font-color is not a valid CSS property. So DevTools immediately flagged it and alerted us.
Visualize and test element states
➡️ Select the Element you want to visualize the states for from the Elements pane. Then click on ....
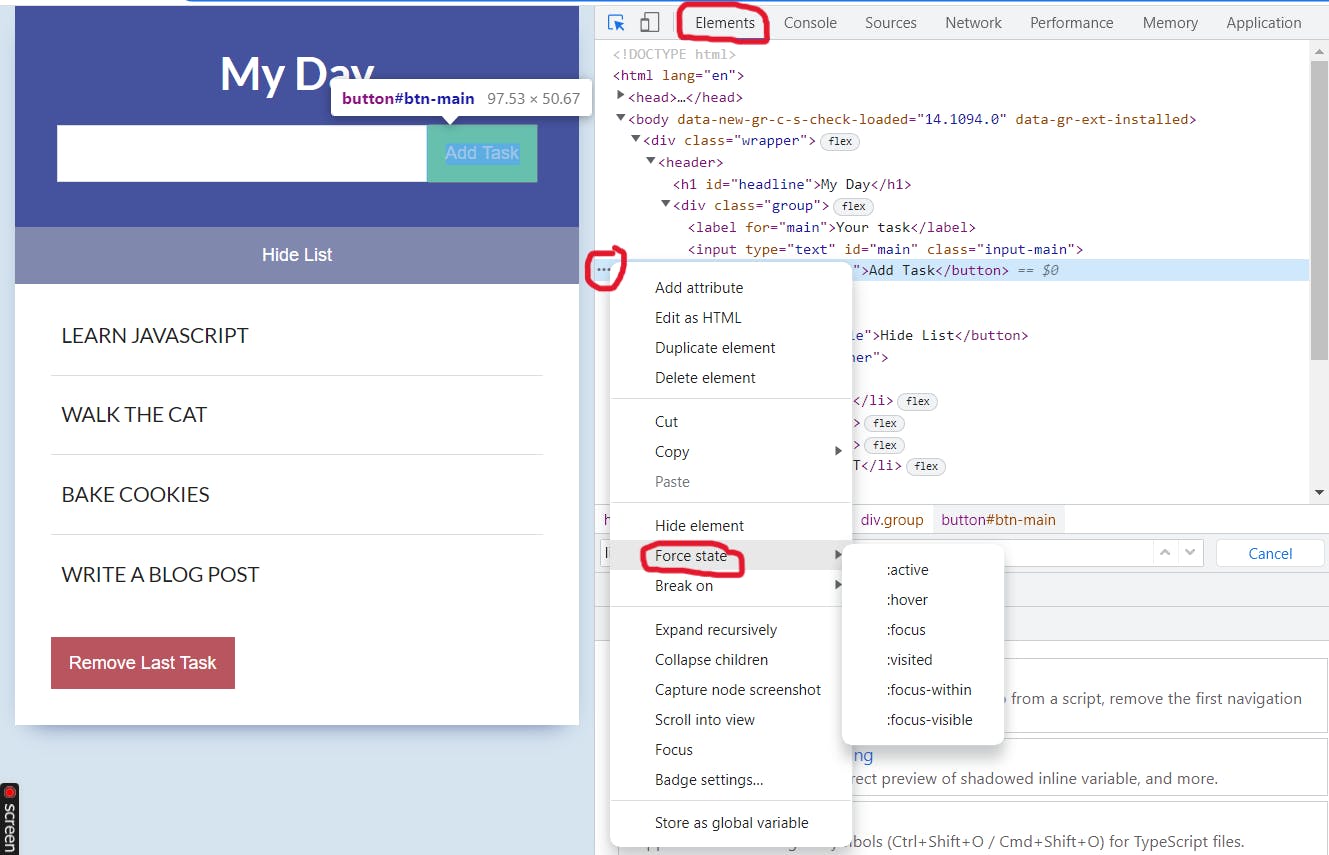
Select the desired pseudo-class (active, hover, focus, visited, etc.) to enable it.
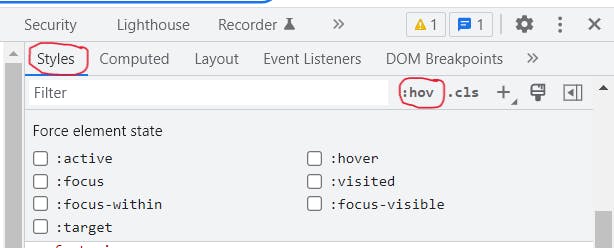
➡️ Clicking on the :hov in the Styles pane also lets you enable and disable element states for the selected element by checking and unchecking the boxes.
Add, Enable and Disable classes
By selecting an element and Clicking on the :cls in the Styles pane also lets you see all the classes associated with that particular element.
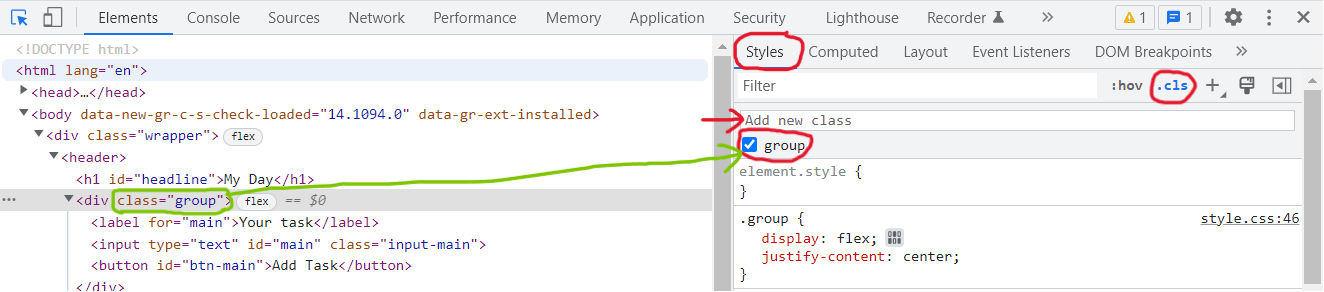
From here you can disable or enable classes by clicking on the checkboxes (☑️). We can also add a new class using the Add new class (shown with a red arrow) text field. We can enter the new class name that we want to add to the selected element and press Enter.
If we have made a lot of important changes, DevTools provide you with an easy way to copy your changes into your source CSS.
- Click on the file name and line number on the right.
The sources panel opens up displaying the updated form rule and all the latest changes.
You can copy from here and paste it to the source code that's stored on your computer.
Follow this link to know more: Edit files with Workspaces
Visualizing the Box Model and Computed styles
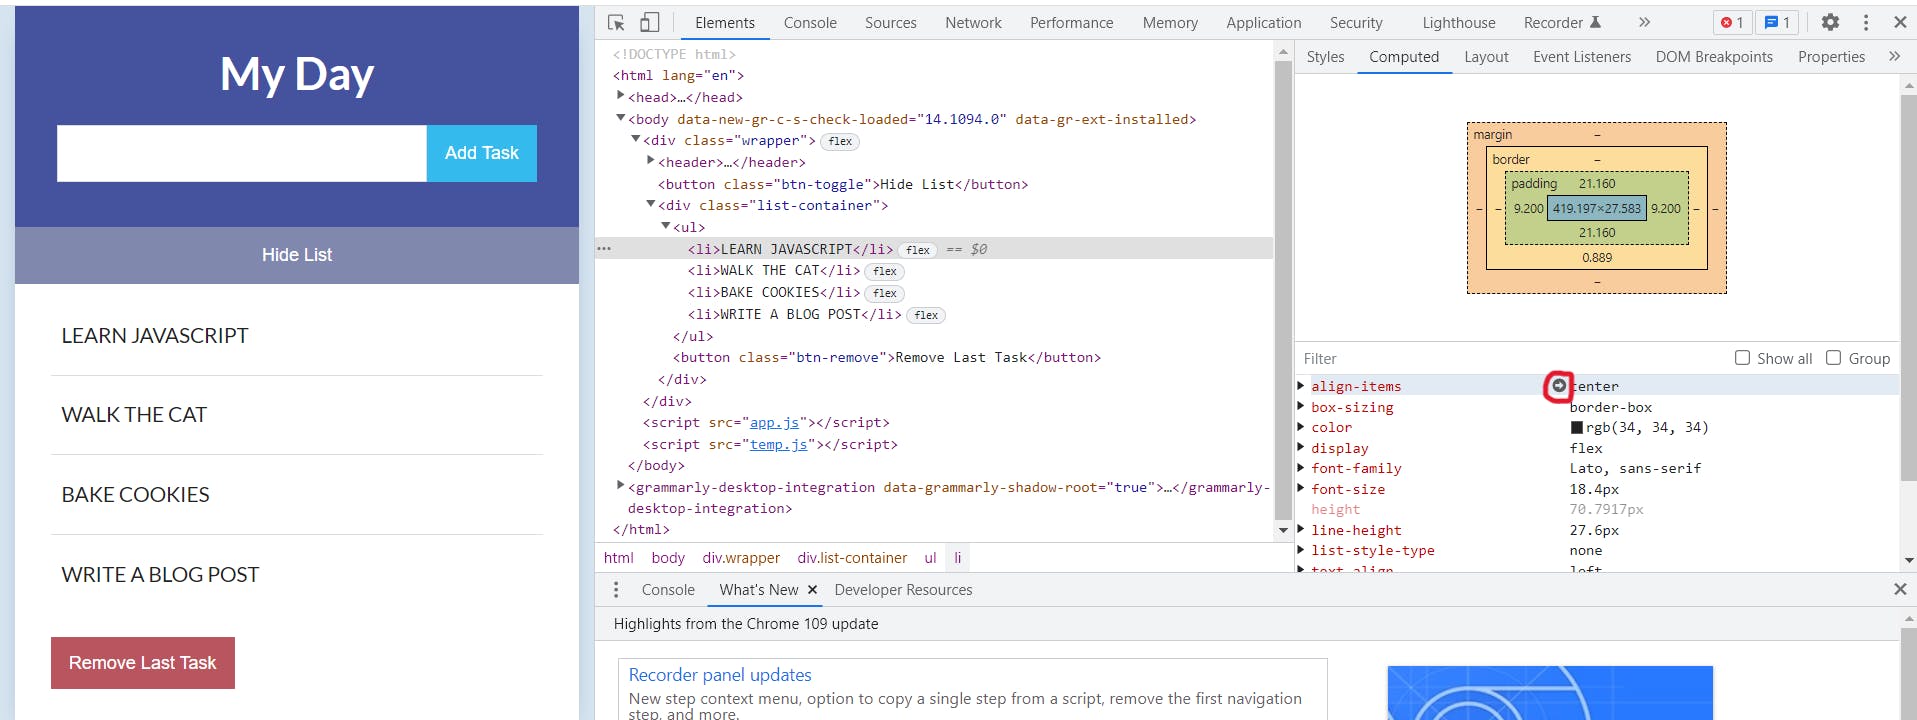
The Computed pane beside the Styles pane shows exactly how the browser is computing your styles.
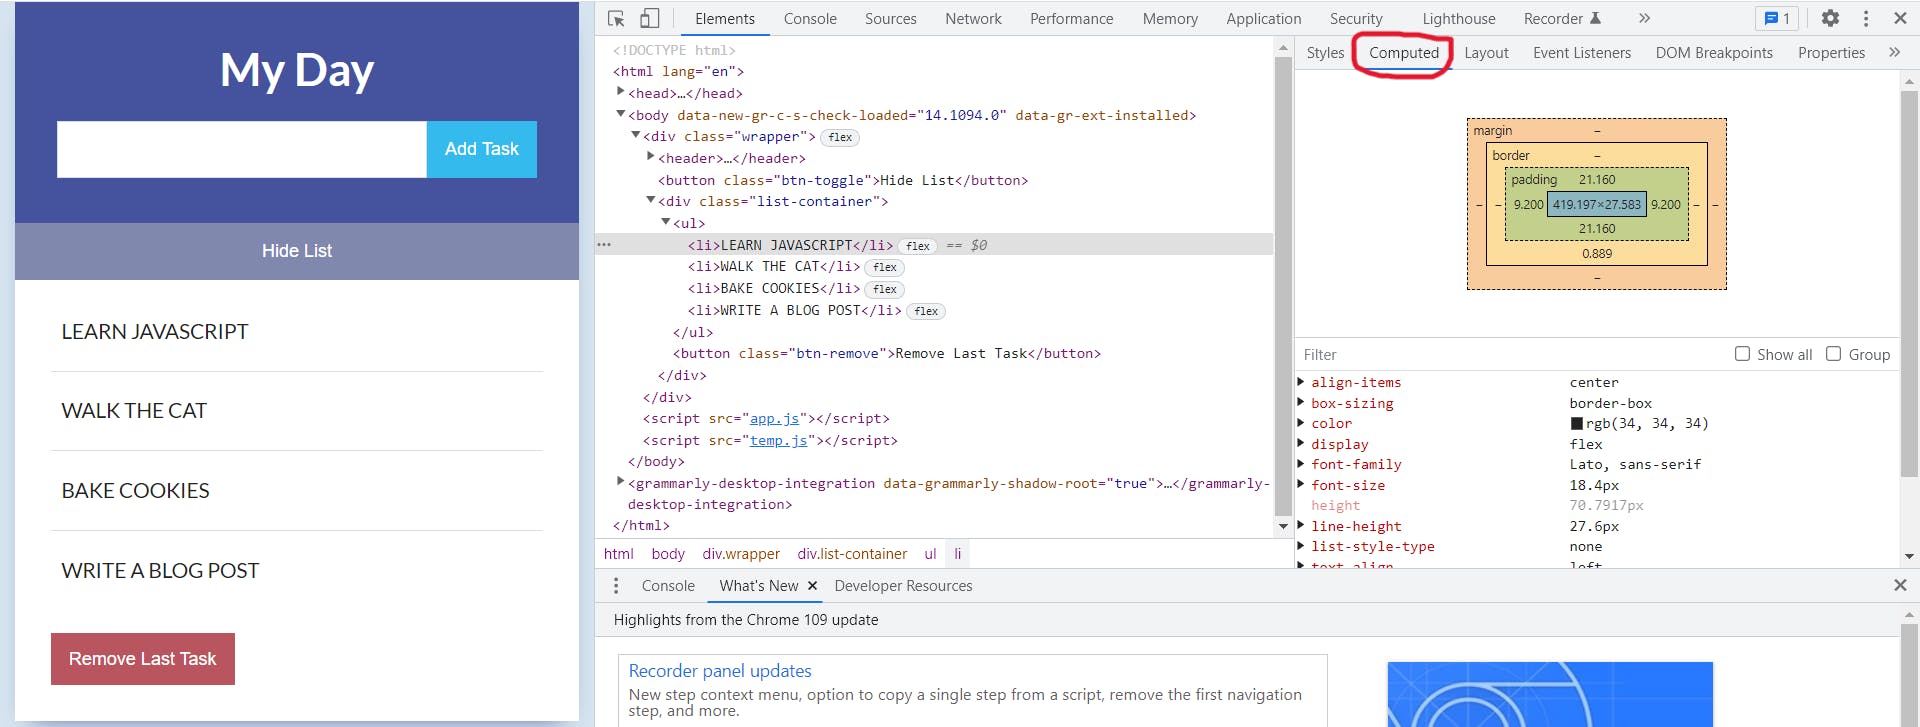
It lets you see the final set of CSS properties your browser applies to the selected element in an alphabetical list of properties. Here we can see all the values in px.
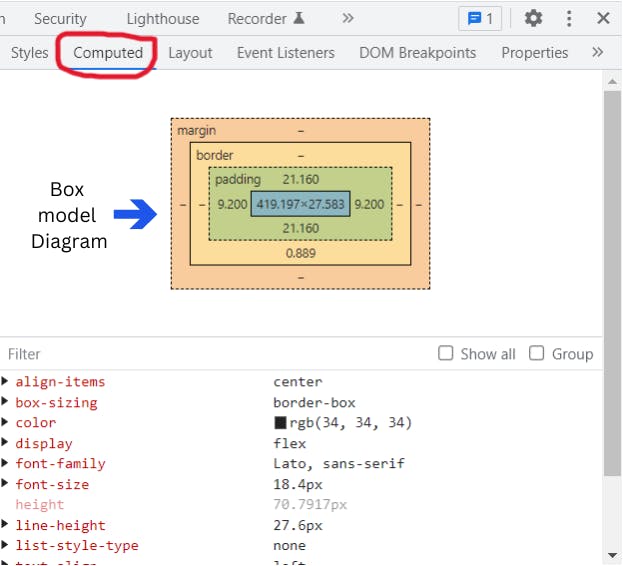
The box model diagram on the top determines the amount of space taken up by each element on the page. When we hover over it, the browser highlights the respective area on the page. All values in the box model can be edited by clicking on them. The up and down arrow keys can be used to increase and decrease the values respectively while editing them.
When we hover on a property an arrow appears. By clicking on the arrow we can go back to its original source in the Styles tab.
📄 The box model - MDN web docs: You can read the MDN Docs to know more about the Box Model.
Conclusion
Chrome DevTools is a powerful addition to the developer's bag of tricks. The Inspect Element feature lets users modify, edit, or add code to an existing web page. As you may find, there are many features offered by browser development tools. Do explore them. Also, it is essential to know them correctly and practice them since it is easy to get lost if you don’t know the correct way. The more you use these tools the more comfortable you will feel with them!